Fig. 11
Download original image
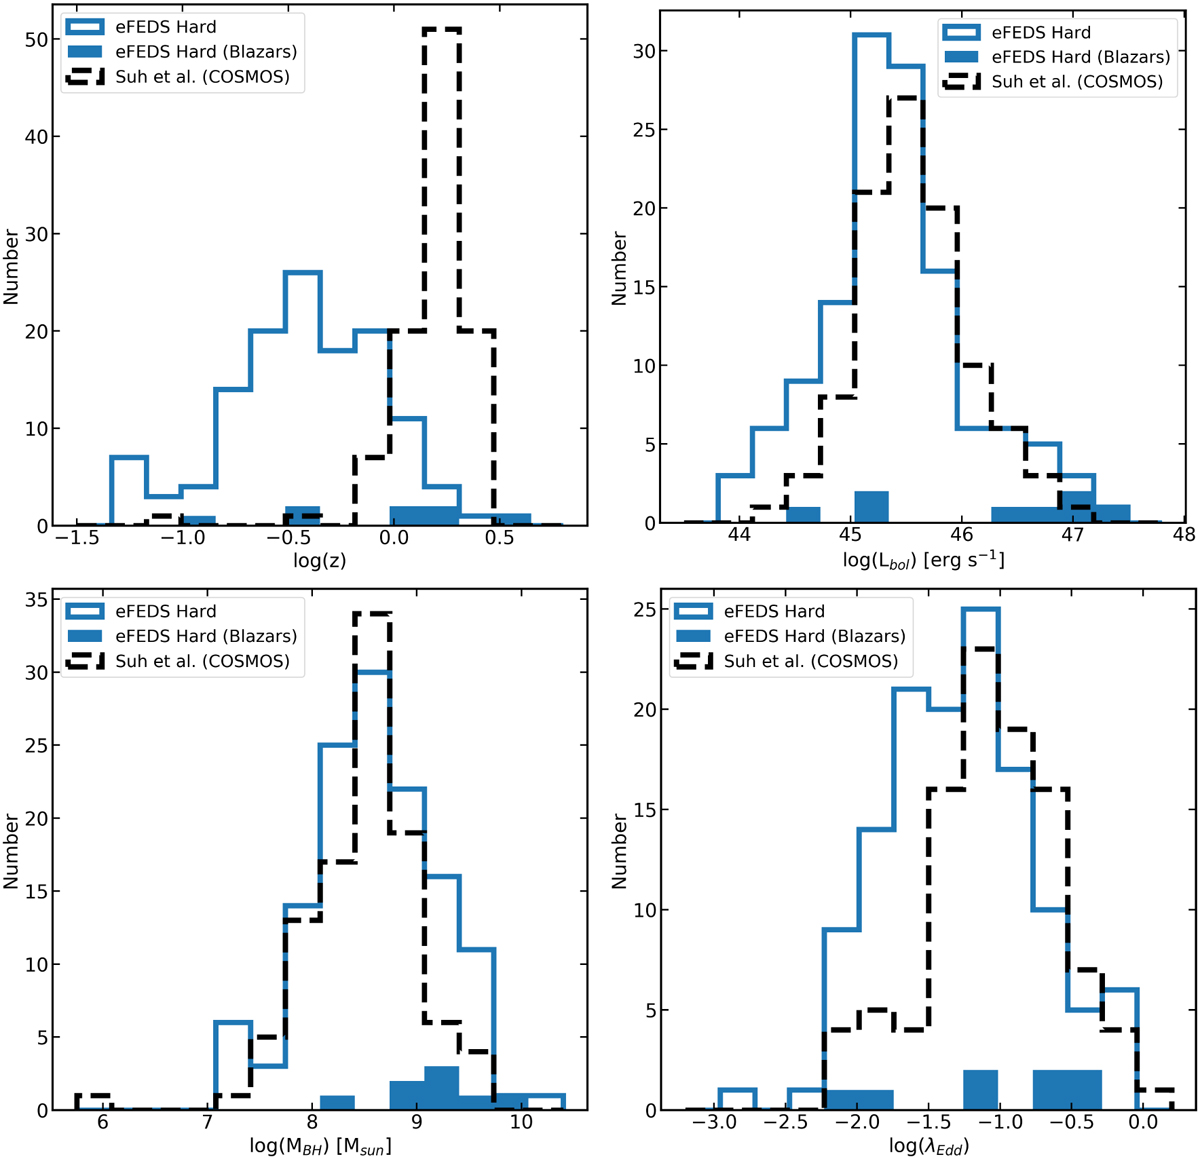
Distribution of the redshift (top left), bolometric luminosity (top right), black hole mass (bottom left) and Eddington ratio (bottom right) for spectroscopically confirmed type 1 AGN in the eFEDS hard sample, shown in blue. The dotted black histogram shows a comparison sample from the Chandra deep survey in the COSMOS field (Suh et al. 2020).
Current usage metrics show cumulative count of Article Views (full-text article views including HTML views, PDF and ePub downloads, according to the available data) and Abstracts Views on Vision4Press platform.
Data correspond to usage on the plateform after 2015. The current usage metrics is available 48-96 hours after online publication and is updated daily on week days.
Initial download of the metrics may take a while.