Fig. 3.
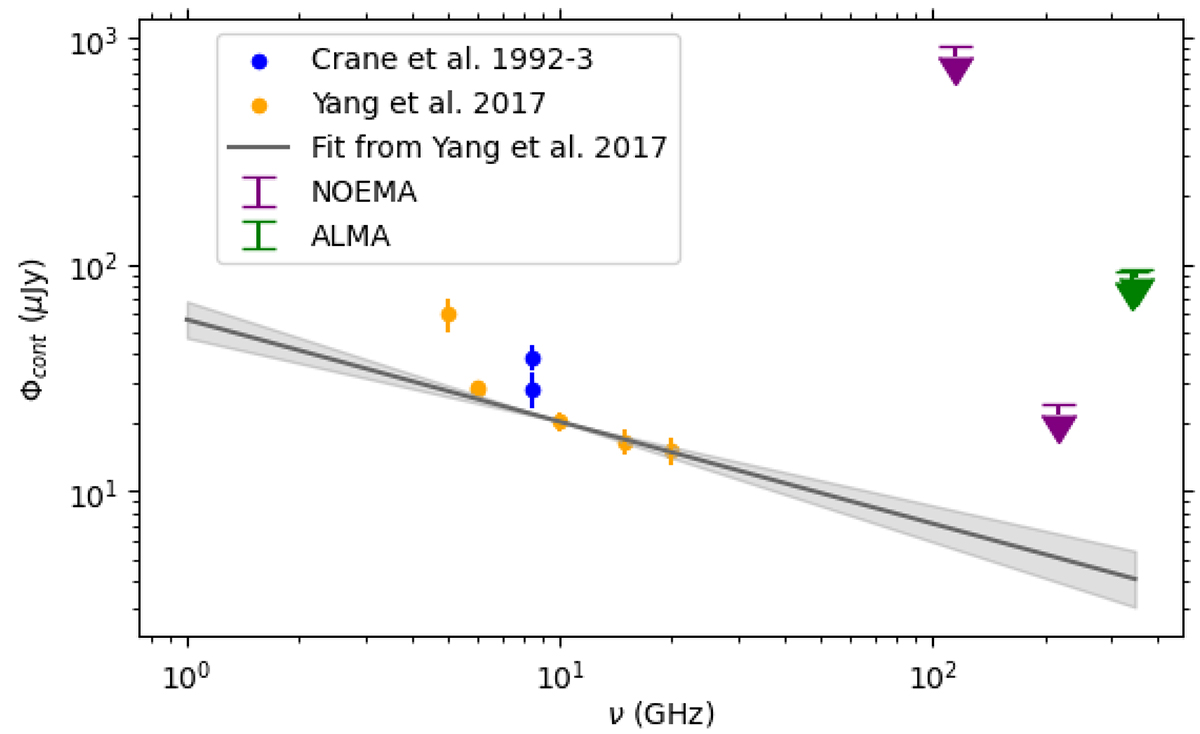
Download original image
Upper limits on the continuum flux. The blue and orange points correspond to the measurements of Crane et al. (1992, 1993), and Yang et al. (2017). The arrows correspond to the upper limits. The ticks correspond to the 3σ upper limit values. The line and associated error bars correspond to the fit discussed in Yang et al. (2017).
Current usage metrics show cumulative count of Article Views (full-text article views including HTML views, PDF and ePub downloads, according to the available data) and Abstracts Views on Vision4Press platform.
Data correspond to usage on the plateform after 2015. The current usage metrics is available 48-96 hours after online publication and is updated daily on week days.
Initial download of the metrics may take a while.