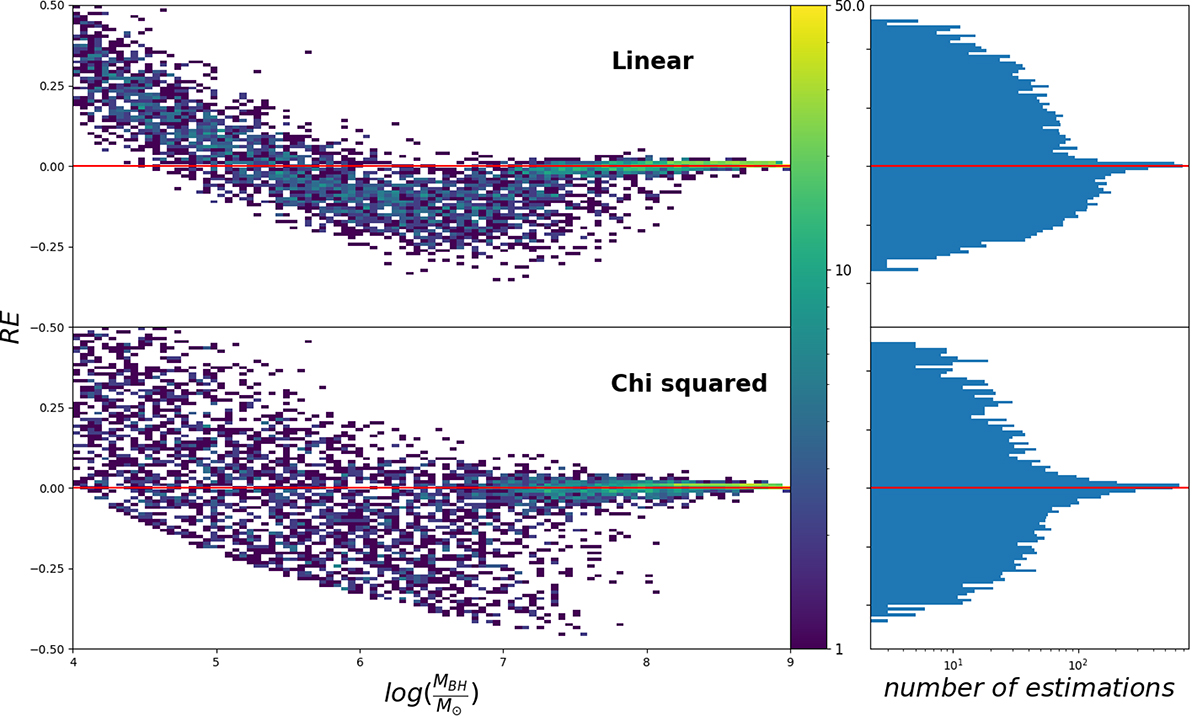
Fig. 5.
Download original image
2D and 1D histograms of the RE from linear interpolation and chi squared fitting of MBH on the test set for NGC 7582. On the left, we plotted the RE when estimating the MBH of the test set as 2D histograms. On the right, we plotted the same RE but as a 1D histogram. On top, we plotted the RE from the linear interpolation and at the bottom, we plotted the RE from the chi squared fitting. The y-axis represents the RE values. The x-axis of the 2D histograms is in ![]() and the 1D histograms axis is in number of estimations.
and the 1D histograms axis is in number of estimations.
Current usage metrics show cumulative count of Article Views (full-text article views including HTML views, PDF and ePub downloads, according to the available data) and Abstracts Views on Vision4Press platform.
Data correspond to usage on the plateform after 2015. The current usage metrics is available 48-96 hours after online publication and is updated daily on week days.
Initial download of the metrics may take a while.