Open Access
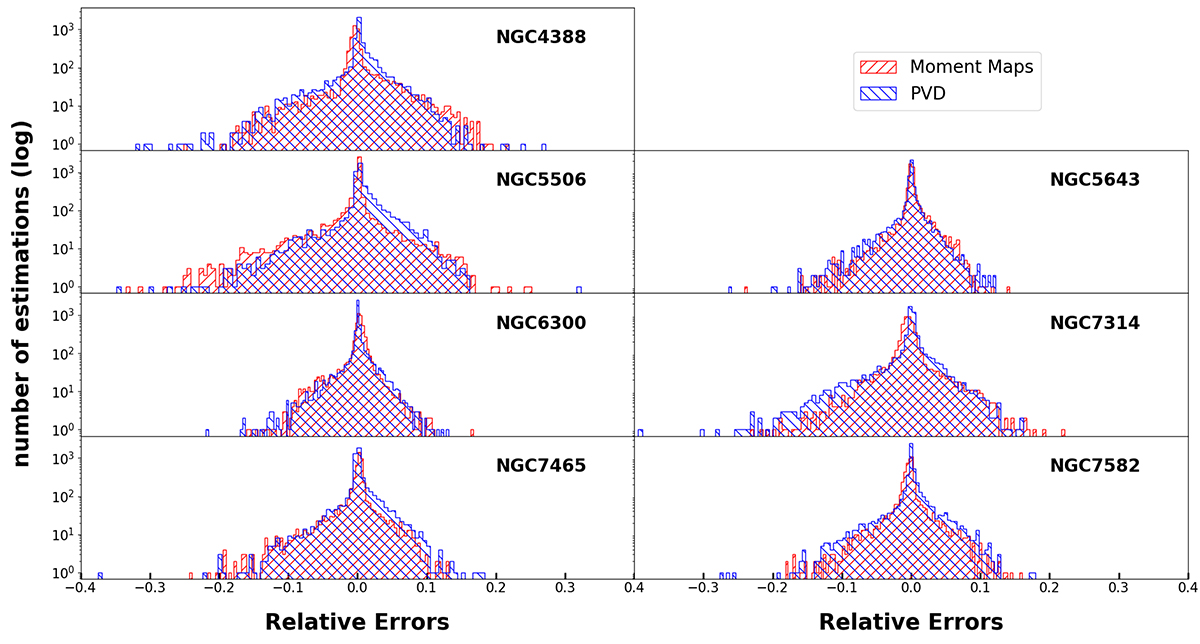
Fig. 2.
Download original image
Histograms of the RE of our models when estimating the MBH of the 5000 simulations from their respective test set. We represent in blue the models trained to estimate the MBH with the PVD, and in red the models trained with the moment maps.
Current usage metrics show cumulative count of Article Views (full-text article views including HTML views, PDF and ePub downloads, according to the available data) and Abstracts Views on Vision4Press platform.
Data correspond to usage on the plateform after 2015. The current usage metrics is available 48-96 hours after online publication and is updated daily on week days.
Initial download of the metrics may take a while.