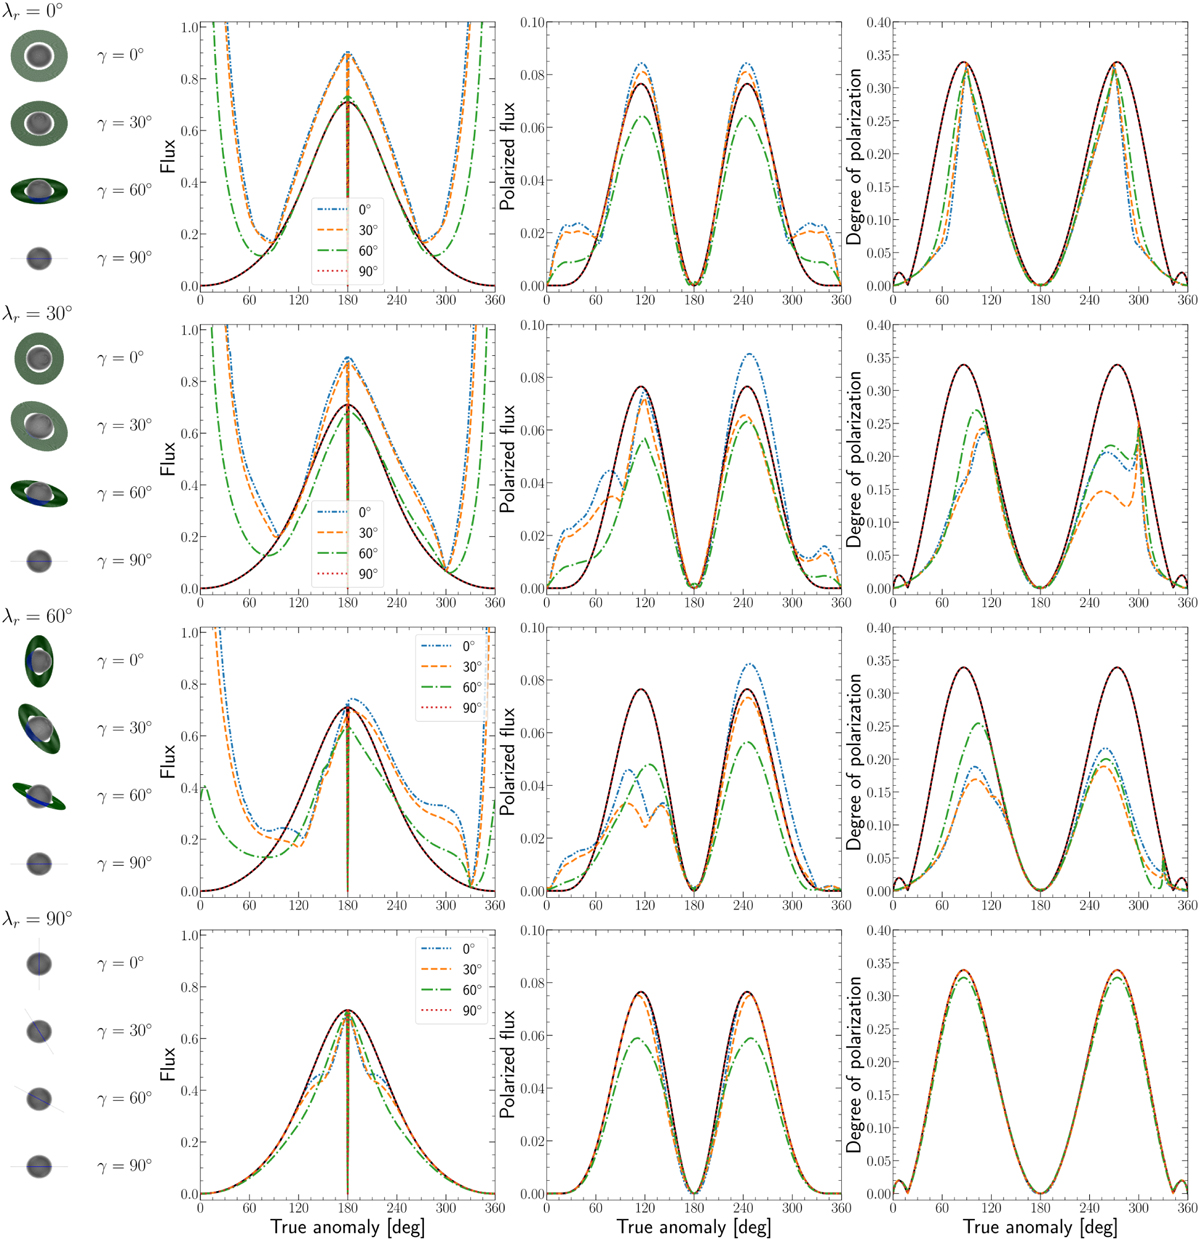
Fig. 7
Download original image
Similar to Fig. 6, except for i = 90°. The images on the left illustrate the system at ν = 0°, which for i = 90° is precisely in front of the star, i.e., the nightside of the planet is turned toward the observer. To keep the structures in the curves visible, we limited the vertical axis in the graphs for F-. In some cases, the forward-scattering peaks are therefore cut off. The missing peak values are the following: for λr = 0°, the lines reach 6.13, 5.37, and 2.25 for γ = 0°, 30°, and 60°, respectively. For λr = 30°, they reach 5.36, 4.61, and 1.55, and for λr = 30°, 2.38 and 1.65 for γ = 0° and γ = 30°, respectively.
Current usage metrics show cumulative count of Article Views (full-text article views including HTML views, PDF and ePub downloads, according to the available data) and Abstracts Views on Vision4Press platform.
Data correspond to usage on the plateform after 2015. The current usage metrics is available 48-96 hours after online publication and is updated daily on week days.
Initial download of the metrics may take a while.