Fig. 9.
Download original image
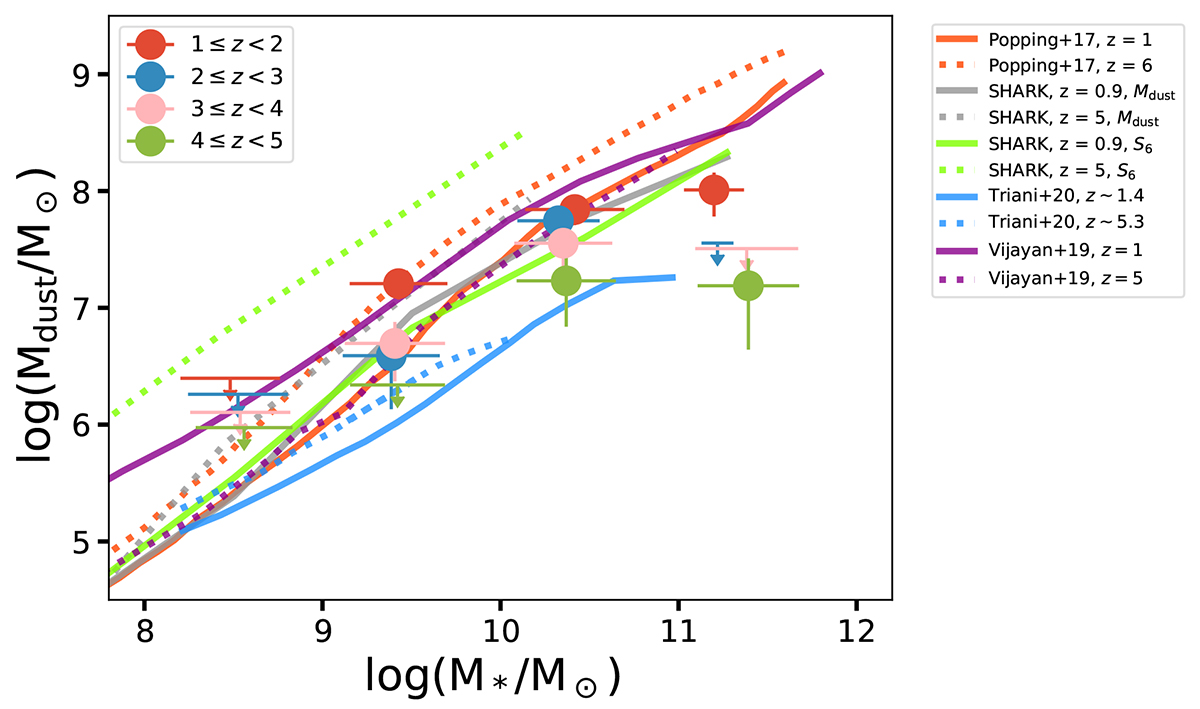
Log average dust mass recovered as a function of the (log) stellar mass in each redshift bin. The circles represent detections (above 3σ), and the 3σ upper limits are represented by down-pointing arrows. We overplot the z = 1 and z = 6 dust mass-stellar mass relation from Popping et al. (2017) and the z ∼ 1 and z ∼ 5 relations from Lagos et al. (2019) (SHARK model), Triani et al. (2020), and Vijayan et al. (2019). We show the average dust mass directly predicted by the SHARK model and the dust mass computed from the predicted band 6 flux following Eq. (1).
Current usage metrics show cumulative count of Article Views (full-text article views including HTML views, PDF and ePub downloads, according to the available data) and Abstracts Views on Vision4Press platform.
Data correspond to usage on the plateform after 2015. The current usage metrics is available 48-96 hours after online publication and is updated daily on week days.
Initial download of the metrics may take a while.