Open Access
Fig. 7.
Download original image
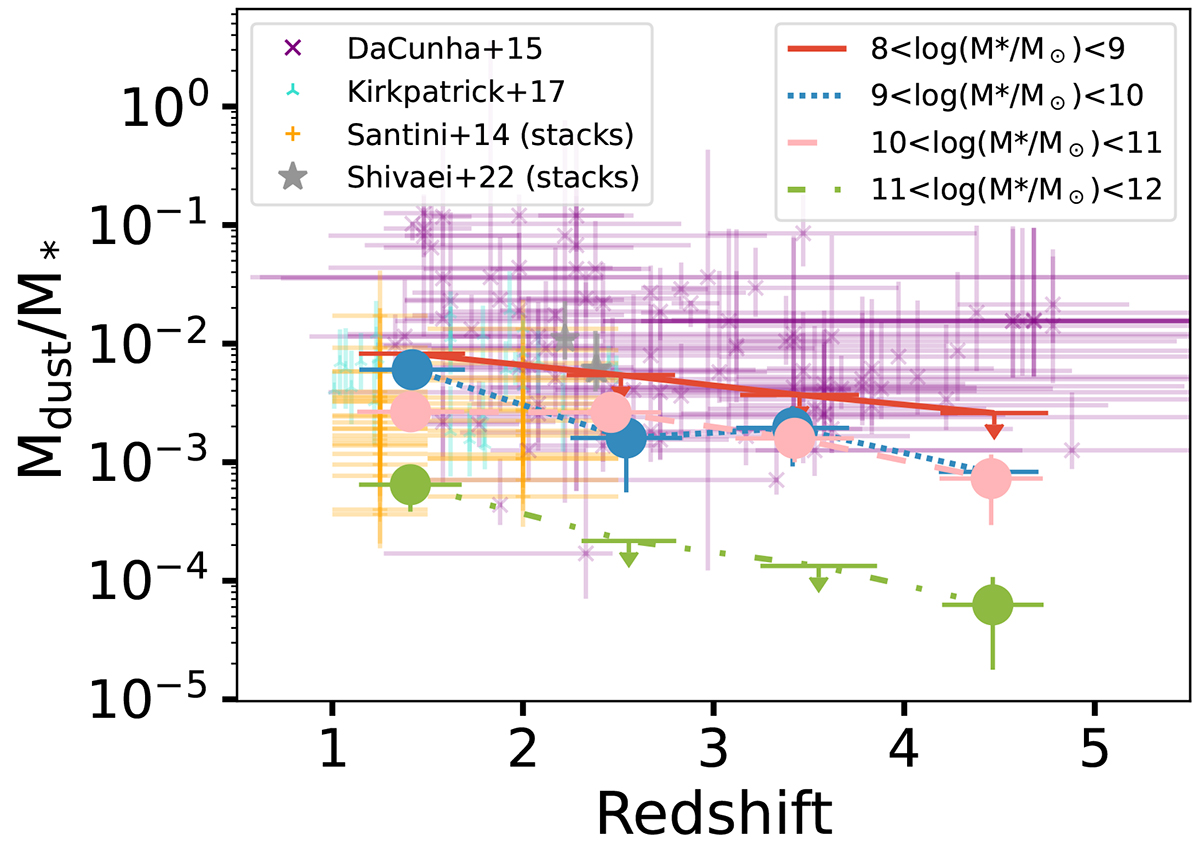
Ratio of the average dust mass to average stellar mass as a function of redshift. Similar to the right panel of Figure 5, but normalized by the stellar mass of the galaxies in the sample. The error bars combine the error on the dust-mass computation and stellar mass distribution.
Current usage metrics show cumulative count of Article Views (full-text article views including HTML views, PDF and ePub downloads, according to the available data) and Abstracts Views on Vision4Press platform.
Data correspond to usage on the plateform after 2015. The current usage metrics is available 48-96 hours after online publication and is updated daily on week days.
Initial download of the metrics may take a while.