Fig. 5.
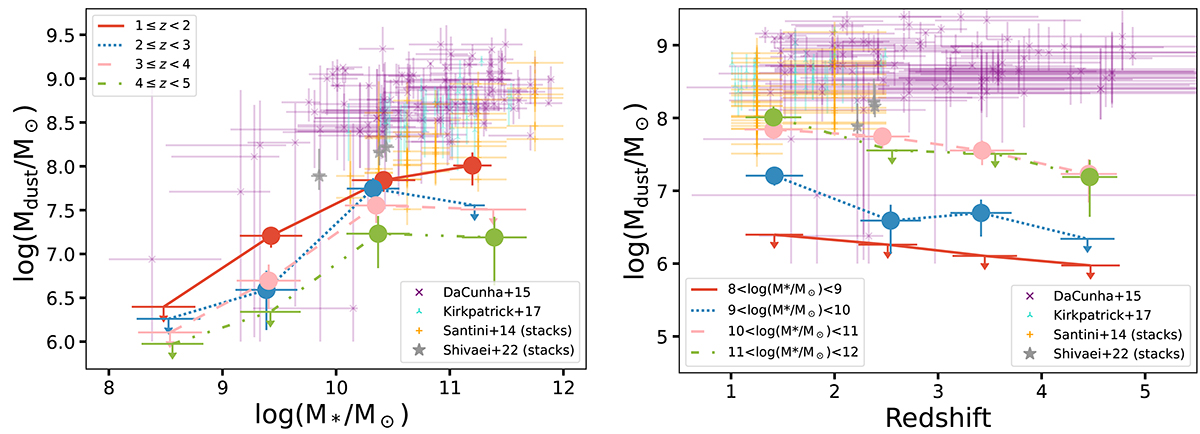
Download original image
Average dust mass evolution with stellar mass and redshift. (left) Average dust mass as a function of the stellar mass in each redshift bin. The circles represent detections (above 3σ), and down-pointing arrows represent 3σ upper limits. The error bars on the dust-mass detections were computed using a combination of different errors (see Sect. 3.4). The error bar along the x-axis represents the 16th to 84th percentile of parameter distribution in the stacked sample. (right) Similar to the left panel, but plotted as a function of redshift in each stellar mass bin. We also show for comparison individual dust-mass measurements detections (da Cunha et al. 2015; Kirkpatrick et al. 2017) and stacking measurements from Santini et al. (2014), Shivaei et al. (2022).
Current usage metrics show cumulative count of Article Views (full-text article views including HTML views, PDF and ePub downloads, according to the available data) and Abstracts Views on Vision4Press platform.
Data correspond to usage on the plateform after 2015. The current usage metrics is available 48-96 hours after online publication and is updated daily on week days.
Initial download of the metrics may take a while.