Fig. 2.
Download original image
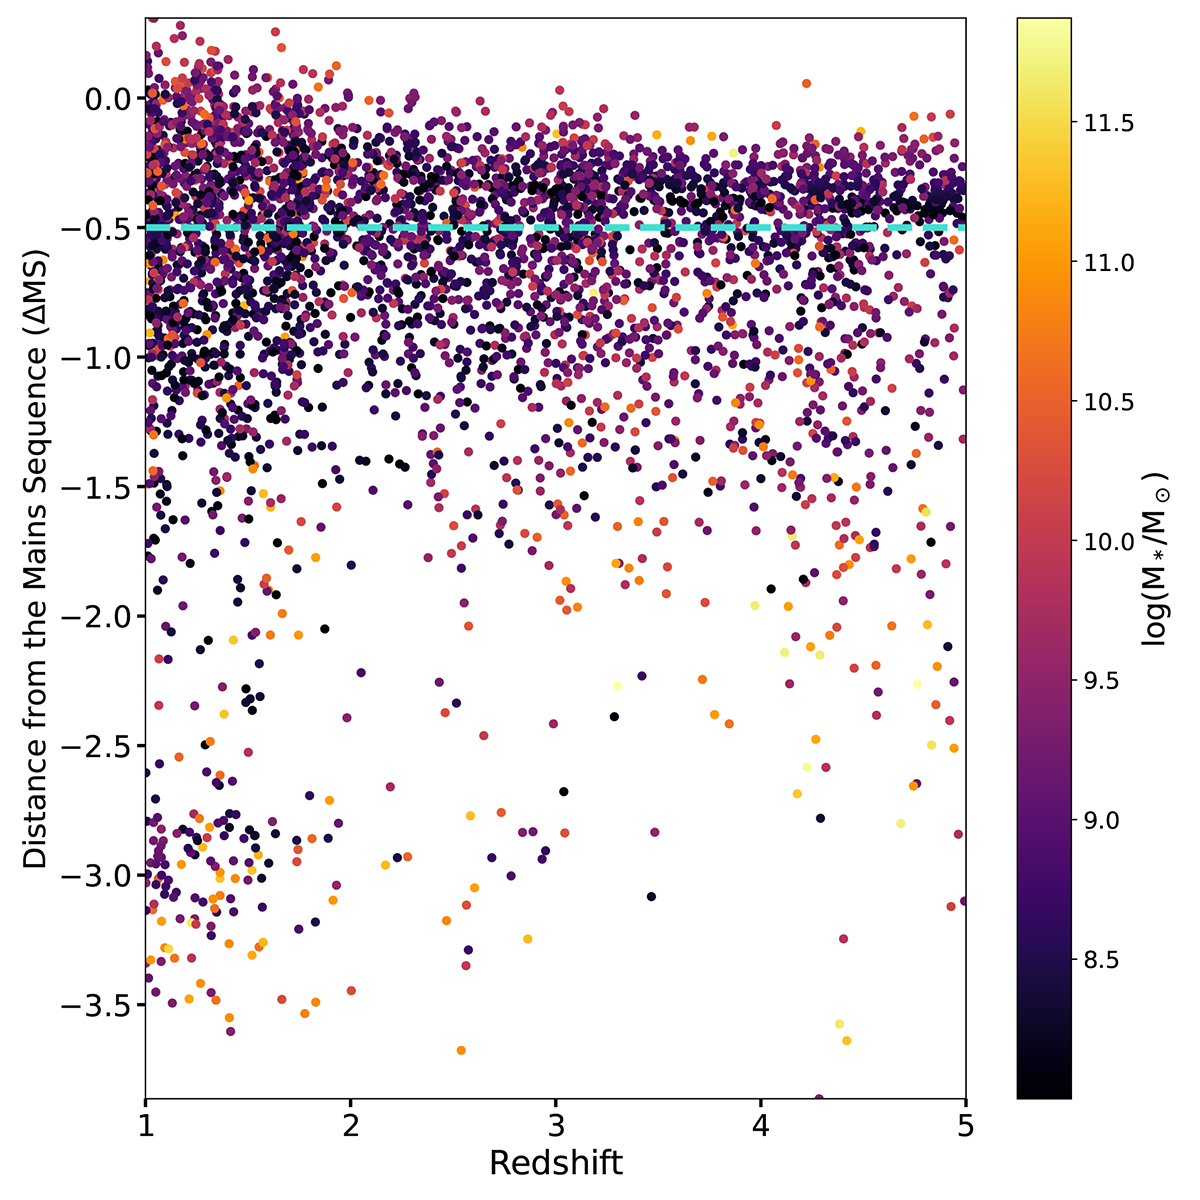
Distance from the main sequence Δ(MS) = log(SFRMS)−log(SFR) (from Speagle et al. 2014) as a function of redshift for the galaxies in the full sample. The points are color-coded according to stellar mass. The dashed line at Δ(MS) = − 0.5 highlights the region from which quiescent galaxies were excluded (see the appendix, which is available on Zenodo).
Current usage metrics show cumulative count of Article Views (full-text article views including HTML views, PDF and ePub downloads, according to the available data) and Abstracts Views on Vision4Press platform.
Data correspond to usage on the plateform after 2015. The current usage metrics is available 48-96 hours after online publication and is updated daily on week days.
Initial download of the metrics may take a while.