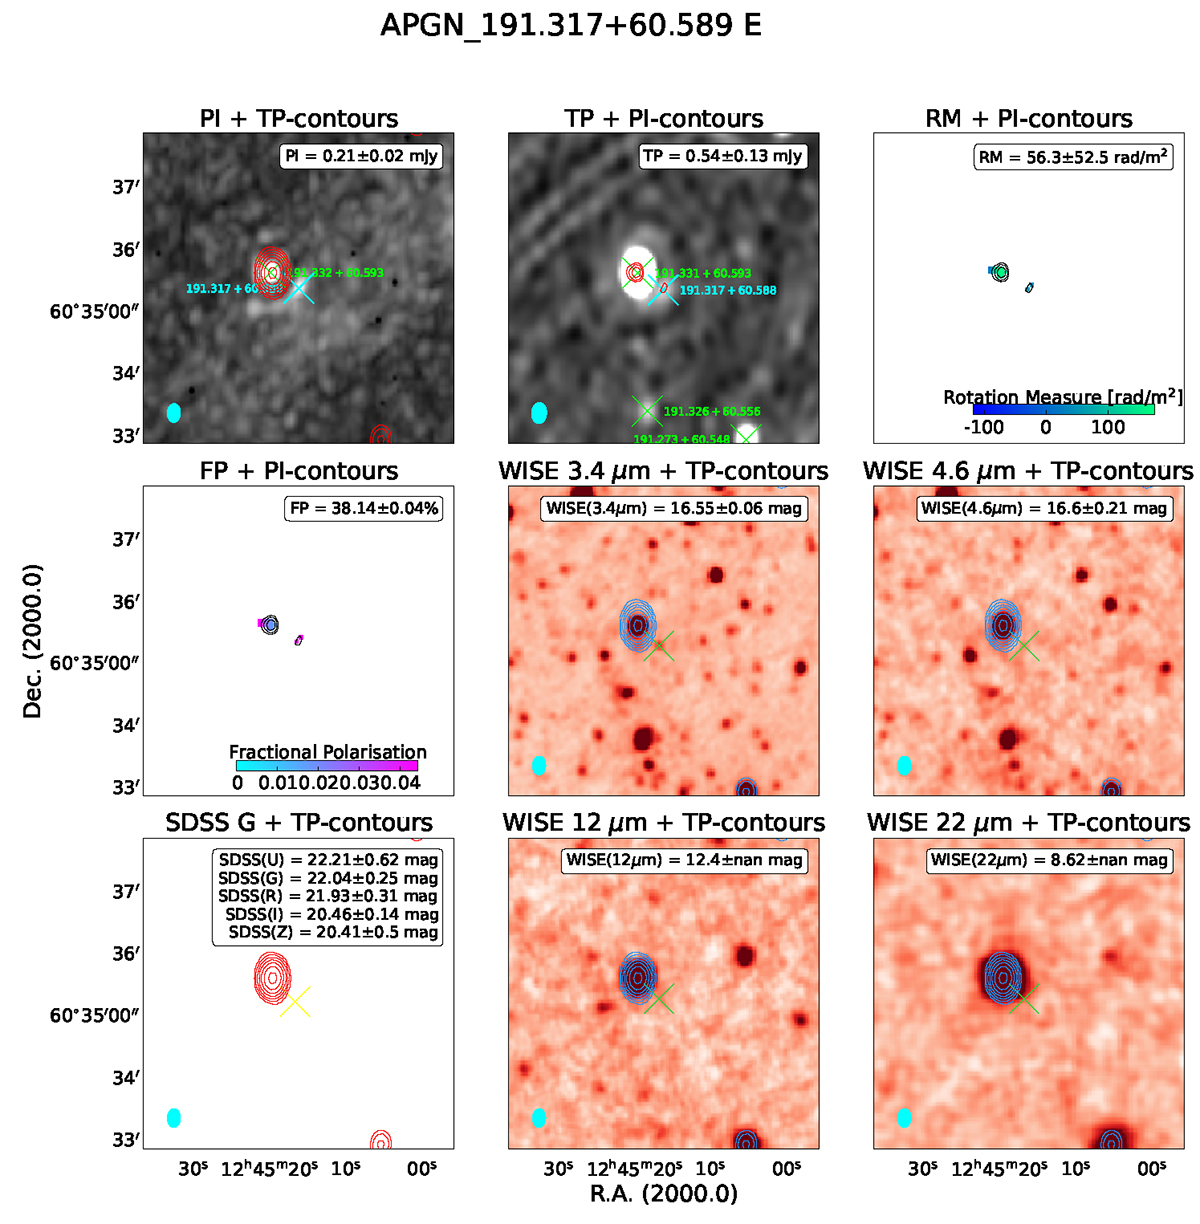
Fig. 2.
Download original image
Example pdf-file created by aperpol to inspect each source by eye. The panels show, from left to right, top to bottom: PI map with TP contours, the TP map with PI contours, RM map, FP map, WISE 3.4 μm map with TP contours, WISE 4.6 μm map with TP contours, SDSS g-band map with TP contours, WISE 12 μm map with TP contours, and the WISE 22 μm map with TP contours. Small green x-marks locate the coordinates of the individual components of PI and TP sources in the first two panels, respectively. Large green x-marks locate the position of other PI sources in the first panel and non-cross-matched TP sources in the second panel, whereas large turquoise x-marks locate the coordinate of the PI source in the first or the cross-matched TP source in the second panel. Large red x-marks in the second panel mark the position of NVSS counterparts. Small green and yellow x-marks identify the position of crossmatched WISE and SDSS sources in the corresponding panels.
Current usage metrics show cumulative count of Article Views (full-text article views including HTML views, PDF and ePub downloads, according to the available data) and Abstracts Views on Vision4Press platform.
Data correspond to usage on the plateform after 2015. The current usage metrics is available 48-96 hours after online publication and is updated daily on week days.
Initial download of the metrics may take a while.