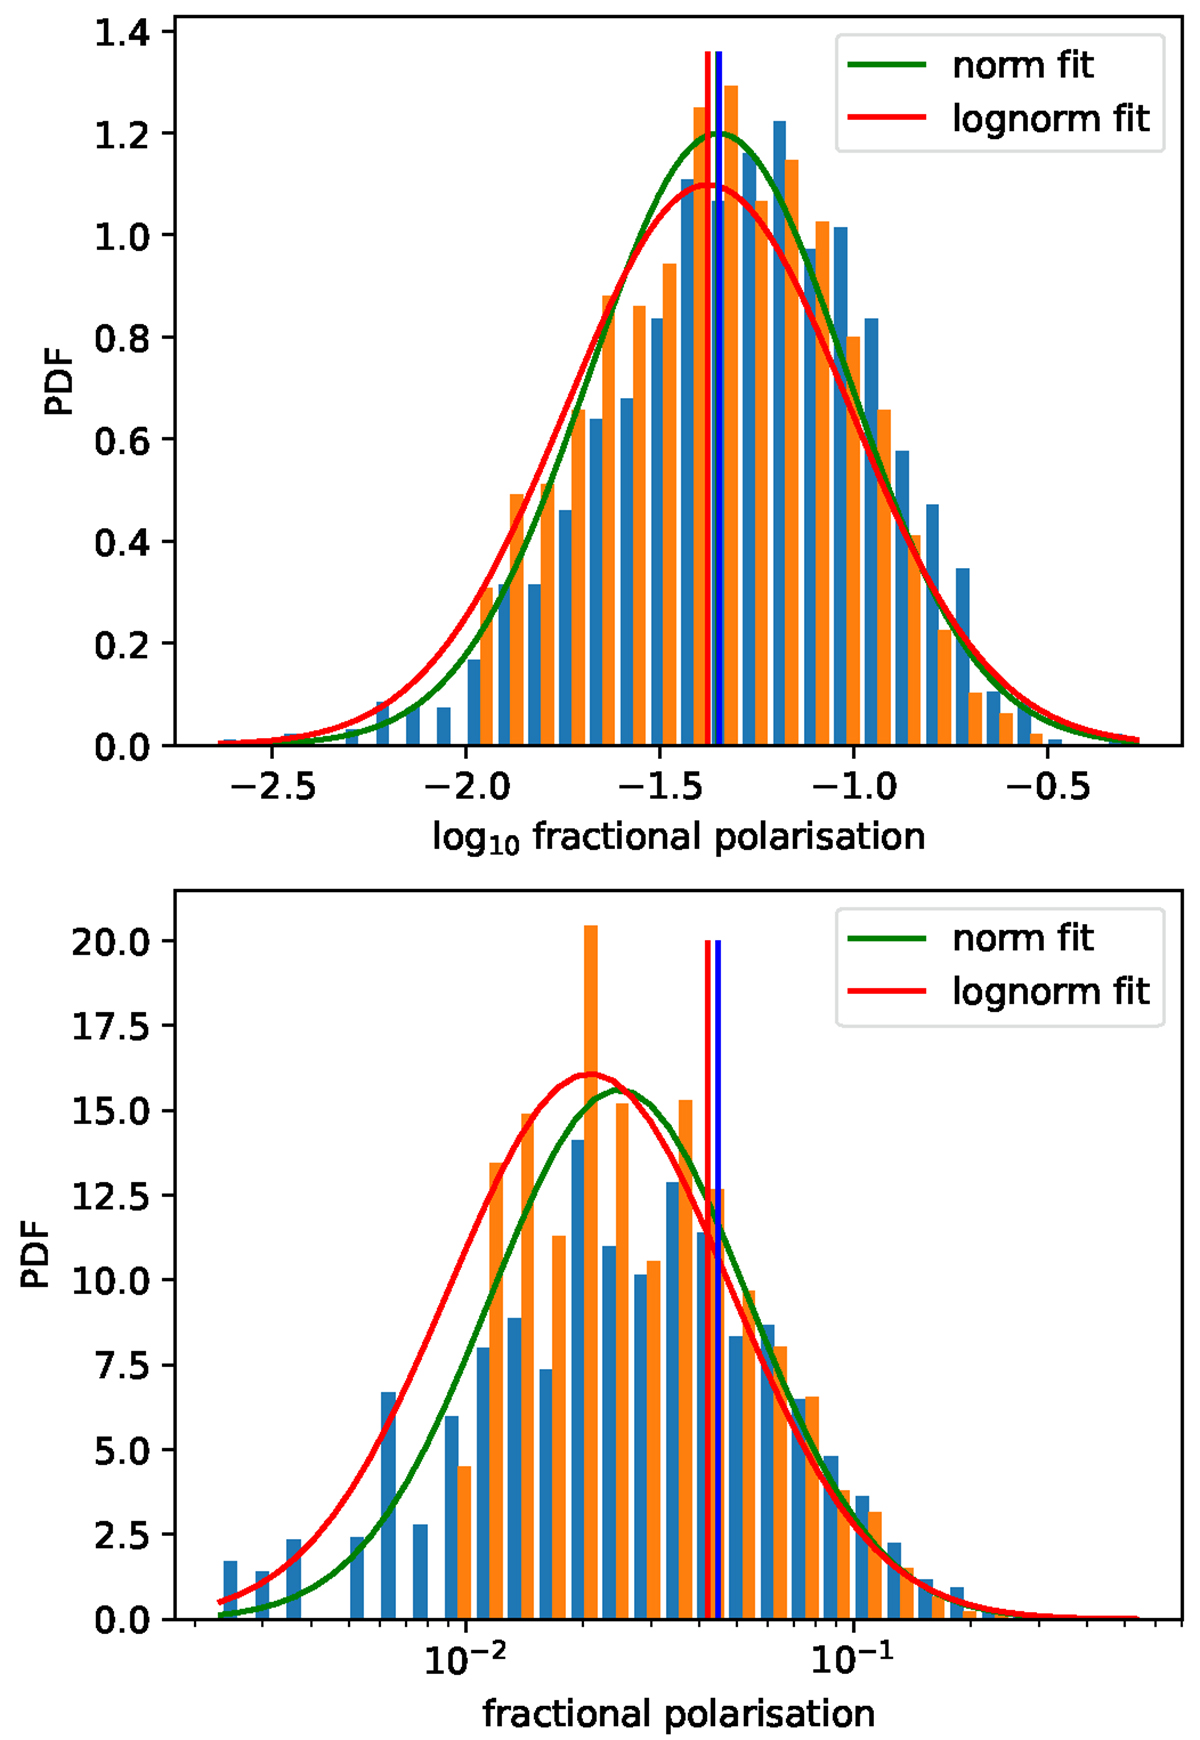
Fig. 11.
Download original image
PDF of the fractional polarisation of the GN sources. The distribution of all detected sources in our sample are shown in blue (we note that the sources with FP ≤ 1% are excluded from all analysis since those values are very uncertain and probably heavily influenced by polarisation bias and leakage), while the orange sample (FP ≥ 1% and TP ≥ 10 mJy) is the sample used for fitting.
Current usage metrics show cumulative count of Article Views (full-text article views including HTML views, PDF and ePub downloads, according to the available data) and Abstracts Views on Vision4Press platform.
Data correspond to usage on the plateform after 2015. The current usage metrics is available 48-96 hours after online publication and is updated daily on week days.
Initial download of the metrics may take a while.