Fig. 10.
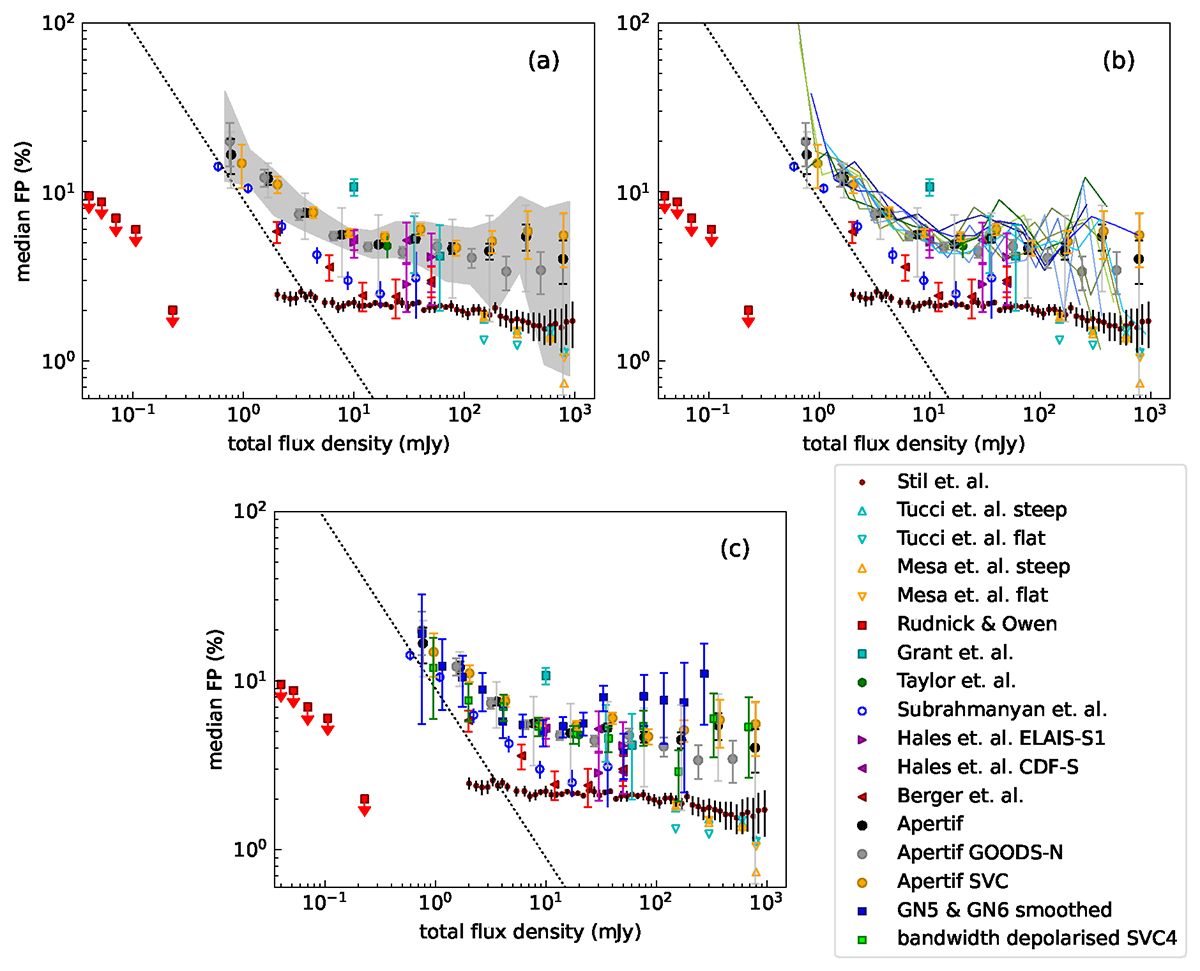
Download original image
Median fractional polarisation over total intensity. Data from the literature compared to our Apertif GN, SVC data and the combination of both in plot (a), the grey error bars to the full Apertif sample represent the sample variance, the area in which the individual bootstrap samples are located is visualised in grey. Plot (b) presents the individual GN and SVC fields as lines. Plot (c) shows the effect of bandwidth and beam depolarisation on selected data sets from the GN and SVC data. The dotted line in each plot gives our detection limit of PI ≥ 90 μJy.
Current usage metrics show cumulative count of Article Views (full-text article views including HTML views, PDF and ePub downloads, according to the available data) and Abstracts Views on Vision4Press platform.
Data correspond to usage on the plateform after 2015. The current usage metrics is available 48-96 hours after online publication and is updated daily on week days.
Initial download of the metrics may take a while.