Fig. 9
Download original image
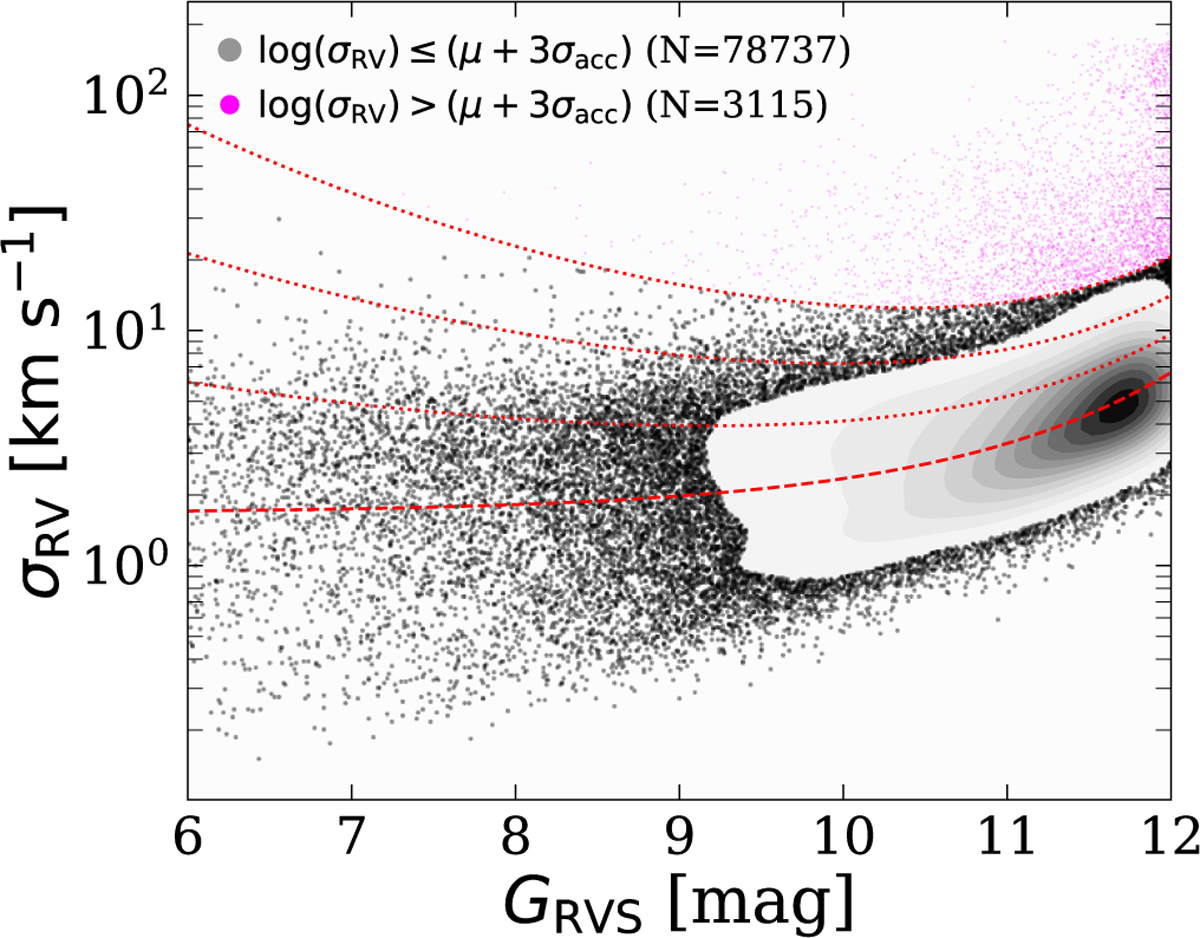
Gaia standard deviation of the epoch RV measurement as a function of RVS apparent magnitude (σRV − GRVS) of accelerated Gaia sources. A dashed red line marks our best-fit curve using the Bayesian model of Eq. (8). Dotted red curves mark the 1, 2, and 3σacc uncertainties. Magenta points above 3σacc are considered possible close-binary sources in accelerated solutions, while black points and respective contours indicate regions of higher data concentration of accelerated solutions.
Current usage metrics show cumulative count of Article Views (full-text article views including HTML views, PDF and ePub downloads, according to the available data) and Abstracts Views on Vision4Press platform.
Data correspond to usage on the plateform after 2015. The current usage metrics is available 48-96 hours after online publication and is updated daily on week days.
Initial download of the metrics may take a while.