Fig. 5
Download original image
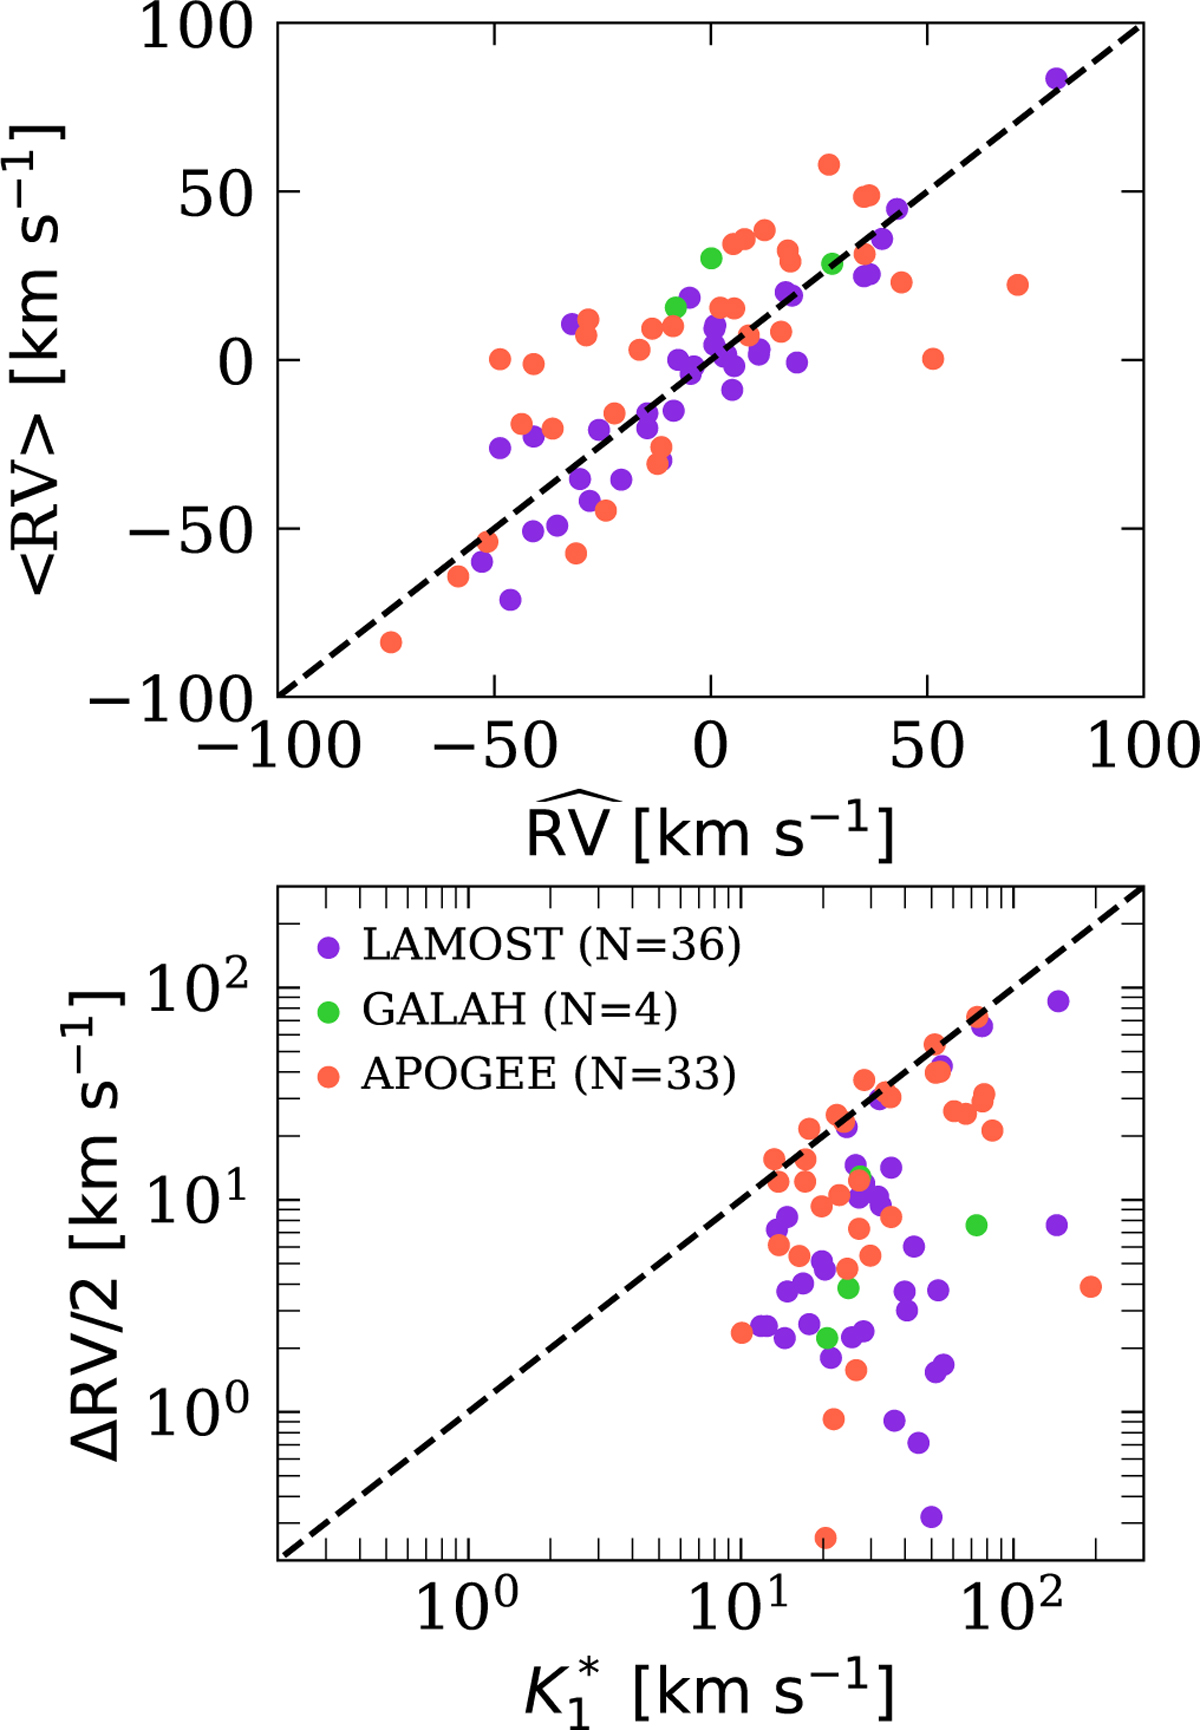
Ground-based RVs validation. Upper panel: scatter plot of the average surveys RV epochs as a function of the median Gaia RV value ![]() . Lower panel: half the peak-to-peak variation in the surveys’ RV epochs as a function of the estimated spectroscopic semi-amplitude
. Lower panel: half the peak-to-peak variation in the surveys’ RV epochs as a function of the estimated spectroscopic semi-amplitude ![]() . Violet points mark sources observed by LAMOST, green points sources observed by GALAH, and red points sources observed by APOGEE. Dashed black lines mark a 1:1 relation.
. Violet points mark sources observed by LAMOST, green points sources observed by GALAH, and red points sources observed by APOGEE. Dashed black lines mark a 1:1 relation.
Current usage metrics show cumulative count of Article Views (full-text article views including HTML views, PDF and ePub downloads, according to the available data) and Abstracts Views on Vision4Press platform.
Data correspond to usage on the plateform after 2015. The current usage metrics is available 48-96 hours after online publication and is updated daily on week days.
Initial download of the metrics may take a while.