Fig. 3
Download original image
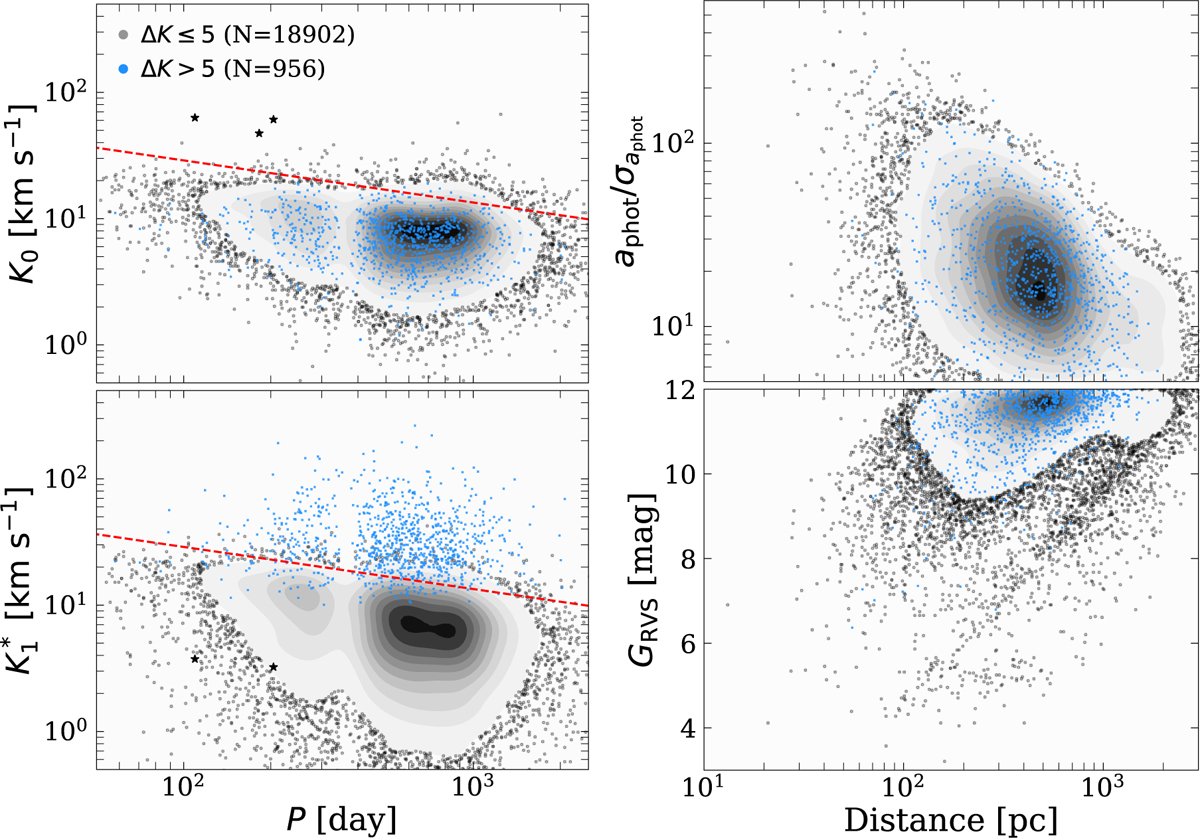
Astrometric binaries (black) and CHT candidates (blue). Left panel: astrometric RV semi-amplitude and the estimated RV amplitude as functions of the orbital period, P (P − K0 and ![]() ). The dashed red lines indicate the expected semi-amplitude for an edge-on 1 M⊙ star with mass ratio q = 1 in a circular orbit. Black star symbols mark sources with K0 significantly above the dashed line (see the main text). The vertical gap in the middle of the datasets reflects Gaia’s insensitivity near 1-year-period binary orbits and its harmonics. Right panel: photocentre significance (top panel) and apparent RVS magnitude (lower panel) as functions of distance (
). The dashed red lines indicate the expected semi-amplitude for an edge-on 1 M⊙ star with mass ratio q = 1 in a circular orbit. Black star symbols mark sources with K0 significantly above the dashed line (see the main text). The vertical gap in the middle of the datasets reflects Gaia’s insensitivity near 1-year-period binary orbits and its harmonics. Right panel: photocentre significance (top panel) and apparent RVS magnitude (lower panel) as functions of distance (![]() and distance − GRVS).
and distance − GRVS).
Current usage metrics show cumulative count of Article Views (full-text article views including HTML views, PDF and ePub downloads, according to the available data) and Abstracts Views on Vision4Press platform.
Data correspond to usage on the plateform after 2015. The current usage metrics is available 48-96 hours after online publication and is updated daily on week days.
Initial download of the metrics may take a while.