Fig. 2
Download original image
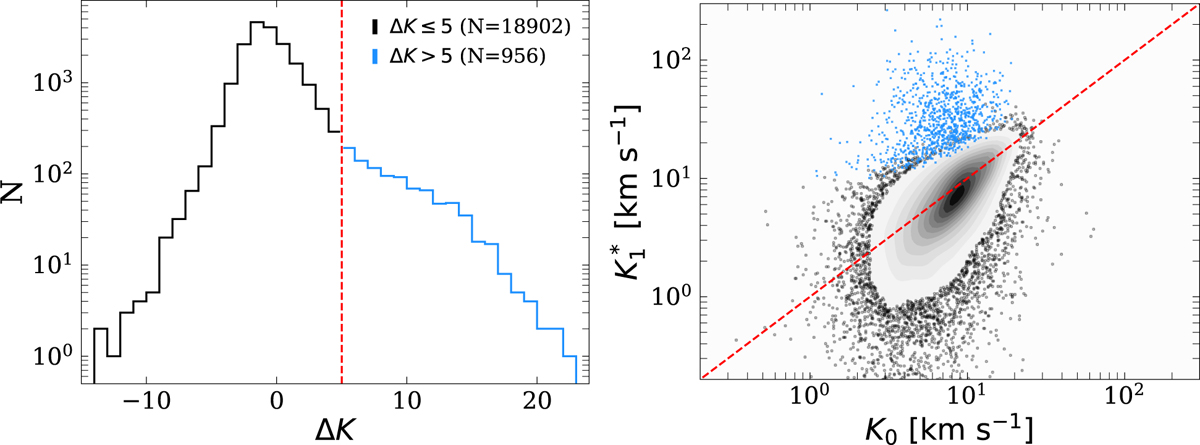
CHT candidates selection. Left panel: Histogram of ∆K. The vertical dashed red line shows our threshold for selecting CHT candidate systems (marked in blue). Right panel: RV-based semi-amplitude as a function of the astrometric semi-amplitude ![]() of the Gaia astrometric binaries sample. Blue points mark sources with ∆K > 5, which can be considered possible CHT systems (inner close binary and an outer astrometric binary), while black points and respective contours indicating regions of higher data concentration mark probable astrometric binaries with ∆K ≤ 5. The dashed red line marks a 1:1 relation.
of the Gaia astrometric binaries sample. Blue points mark sources with ∆K > 5, which can be considered possible CHT systems (inner close binary and an outer astrometric binary), while black points and respective contours indicating regions of higher data concentration mark probable astrometric binaries with ∆K ≤ 5. The dashed red line marks a 1:1 relation.
Current usage metrics show cumulative count of Article Views (full-text article views including HTML views, PDF and ePub downloads, according to the available data) and Abstracts Views on Vision4Press platform.
Data correspond to usage on the plateform after 2015. The current usage metrics is available 48-96 hours after online publication and is updated daily on week days.
Initial download of the metrics may take a while.