Fig. 10
Download original image
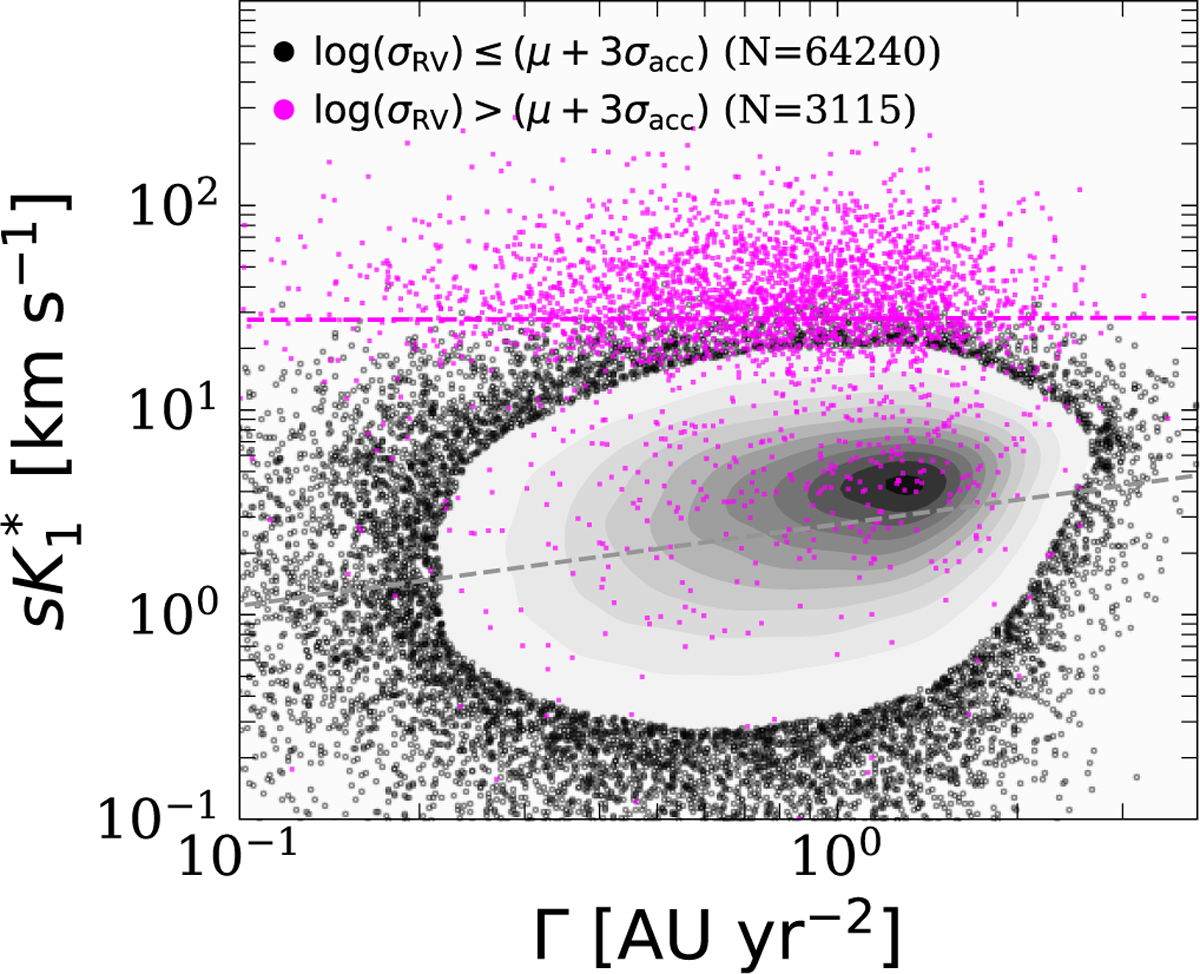
Semi-amplitude proxy as a function of the projected acceleration ![]() of accelerated sources (black points and respective contours indicate regions of higher data concentration) and close binary candidates with a distant accelerated companion (magenta points). Dashed grey and magenta lines mark the slopes of the two samples using a two-dimensional Gaussian fit.
of accelerated sources (black points and respective contours indicate regions of higher data concentration) and close binary candidates with a distant accelerated companion (magenta points). Dashed grey and magenta lines mark the slopes of the two samples using a two-dimensional Gaussian fit.
Current usage metrics show cumulative count of Article Views (full-text article views including HTML views, PDF and ePub downloads, according to the available data) and Abstracts Views on Vision4Press platform.
Data correspond to usage on the plateform after 2015. The current usage metrics is available 48-96 hours after online publication and is updated daily on week days.
Initial download of the metrics may take a while.