Fig. 7.
Download original image
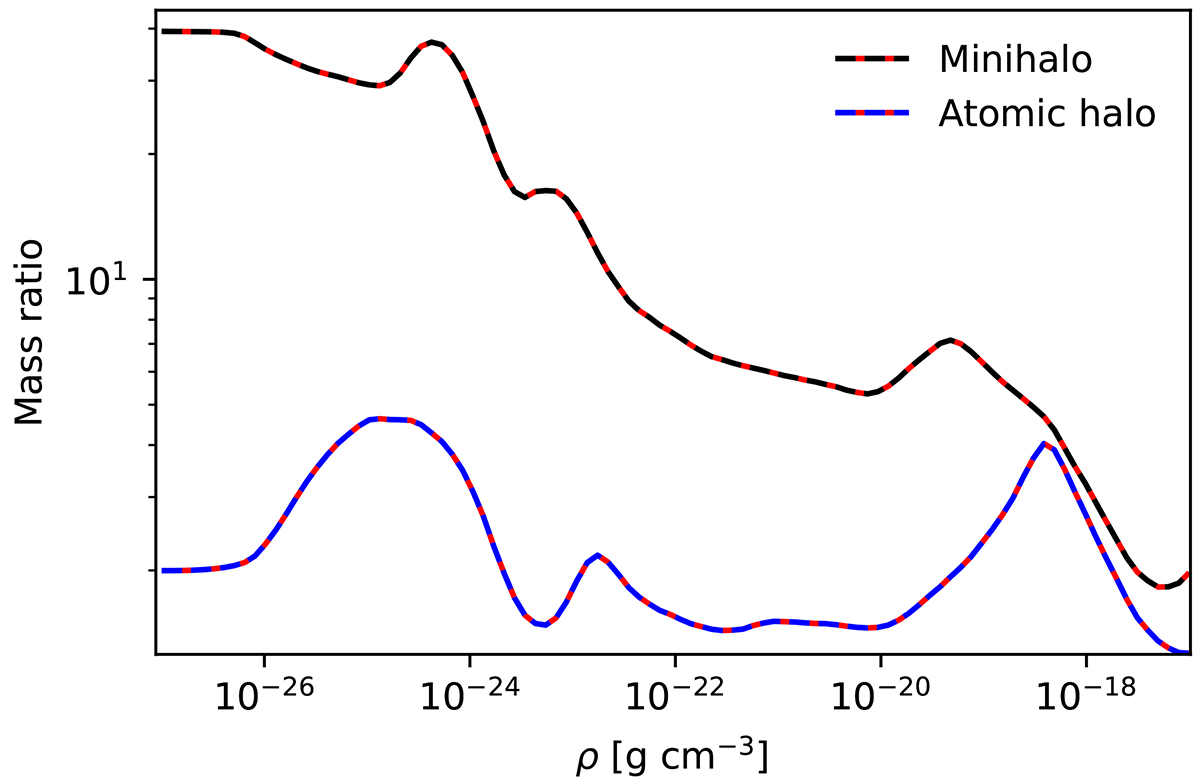
Mass of gas existing at or above density thresholds divided by the values achieved by the fly-by collision for the isolated minihalo and atomic halo scenarios (i.e. the black and blue lines from Fig. 6 divided by the red line from the same figure). This highlights the density ranges in which the fly-by collision hosts significantly more gas than the isolated scenarios.
Current usage metrics show cumulative count of Article Views (full-text article views including HTML views, PDF and ePub downloads, according to the available data) and Abstracts Views on Vision4Press platform.
Data correspond to usage on the plateform after 2015. The current usage metrics is available 48-96 hours after online publication and is updated daily on week days.
Initial download of the metrics may take a while.