Fig. 9
Download original image
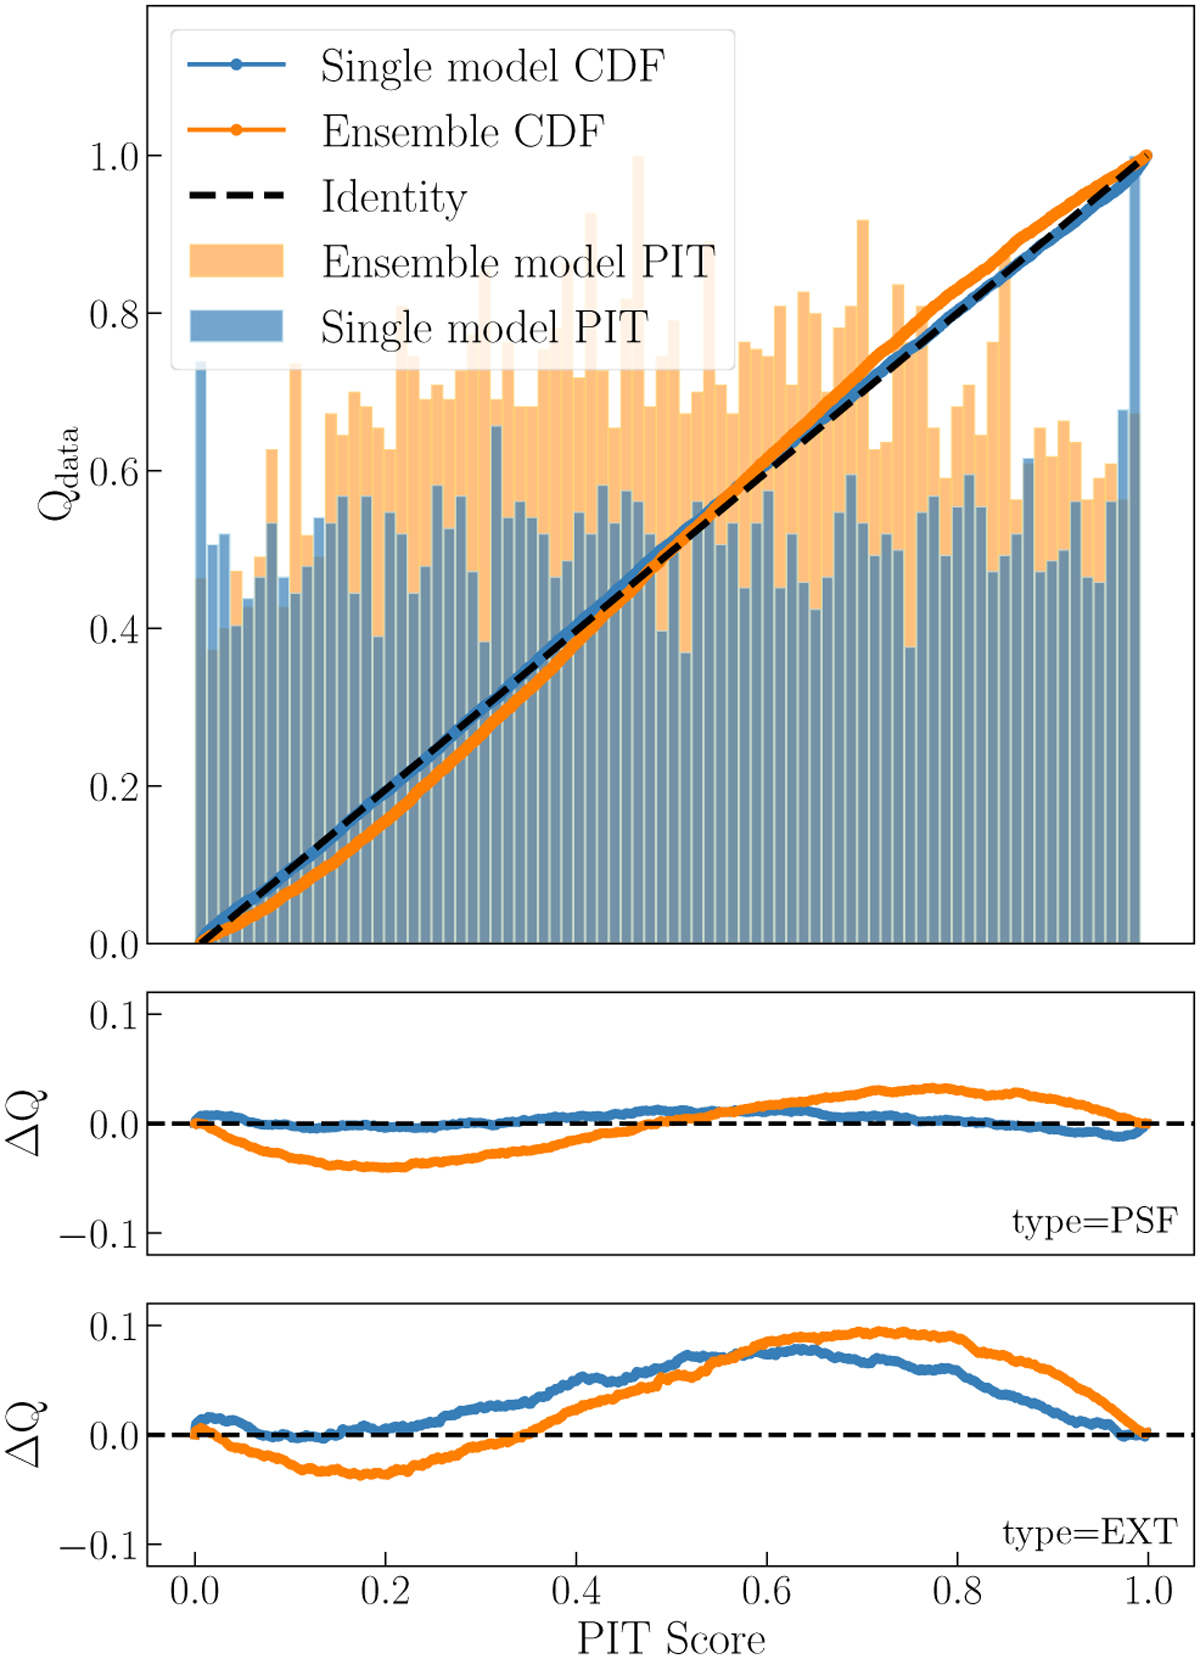
Display of the QQ plot, comparing identity (flat histogram) against the PIT values derived from our redshift PDFs of the validation sample (top panel), and the differences between the QQ plot and identity, highlighting systematic biases or trends for the two morphological classes (PSF and EXT), shown in the bottom panel. For all panels, blue refers to results achieved with a single model (see Figure A.1) while orange reflects the results obtained when utilizing ensemble results (refer to Sect. 5.6).
Current usage metrics show cumulative count of Article Views (full-text article views including HTML views, PDF and ePub downloads, according to the available data) and Abstracts Views on Vision4Press platform.
Data correspond to usage on the plateform after 2015. The current usage metrics is available 48-96 hours after online publication and is updated daily on week days.
Initial download of the metrics may take a while.