Fig. 7
Download original image
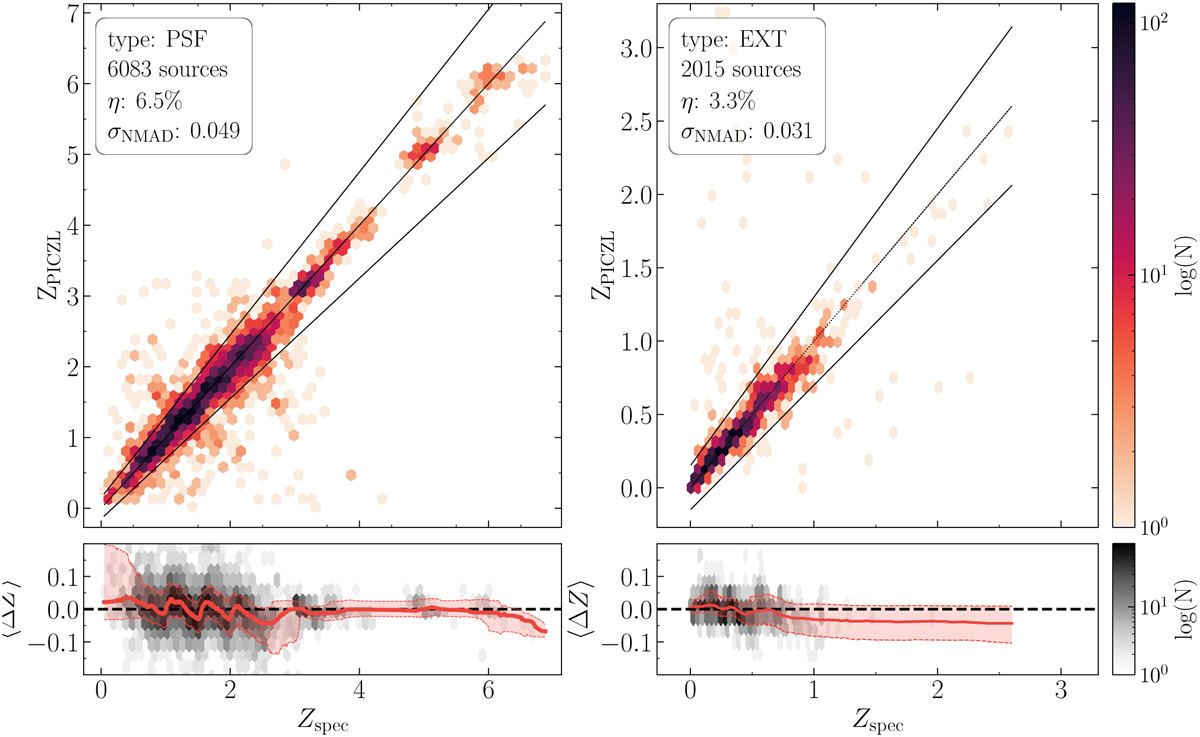
Binned scatter plots of photo-z obtained from our model ZPICZL versus spectroscopic redshift Zspec , for sources classified as type point-like (PSF, left) and extended (EXT, right). Each plot includes identity and two lines denoting the outlier boundary of ![]() . Normalized residuals and trend lines and errors are shown in the bottom panels, aiding in the visualization of systematic deviations across the redshift range.
. Normalized residuals and trend lines and errors are shown in the bottom panels, aiding in the visualization of systematic deviations across the redshift range.
Current usage metrics show cumulative count of Article Views (full-text article views including HTML views, PDF and ePub downloads, according to the available data) and Abstracts Views on Vision4Press platform.
Data correspond to usage on the plateform after 2015. The current usage metrics is available 48-96 hours after online publication and is updated daily on week days.
Initial download of the metrics may take a while.