Fig. E.1
Download original image
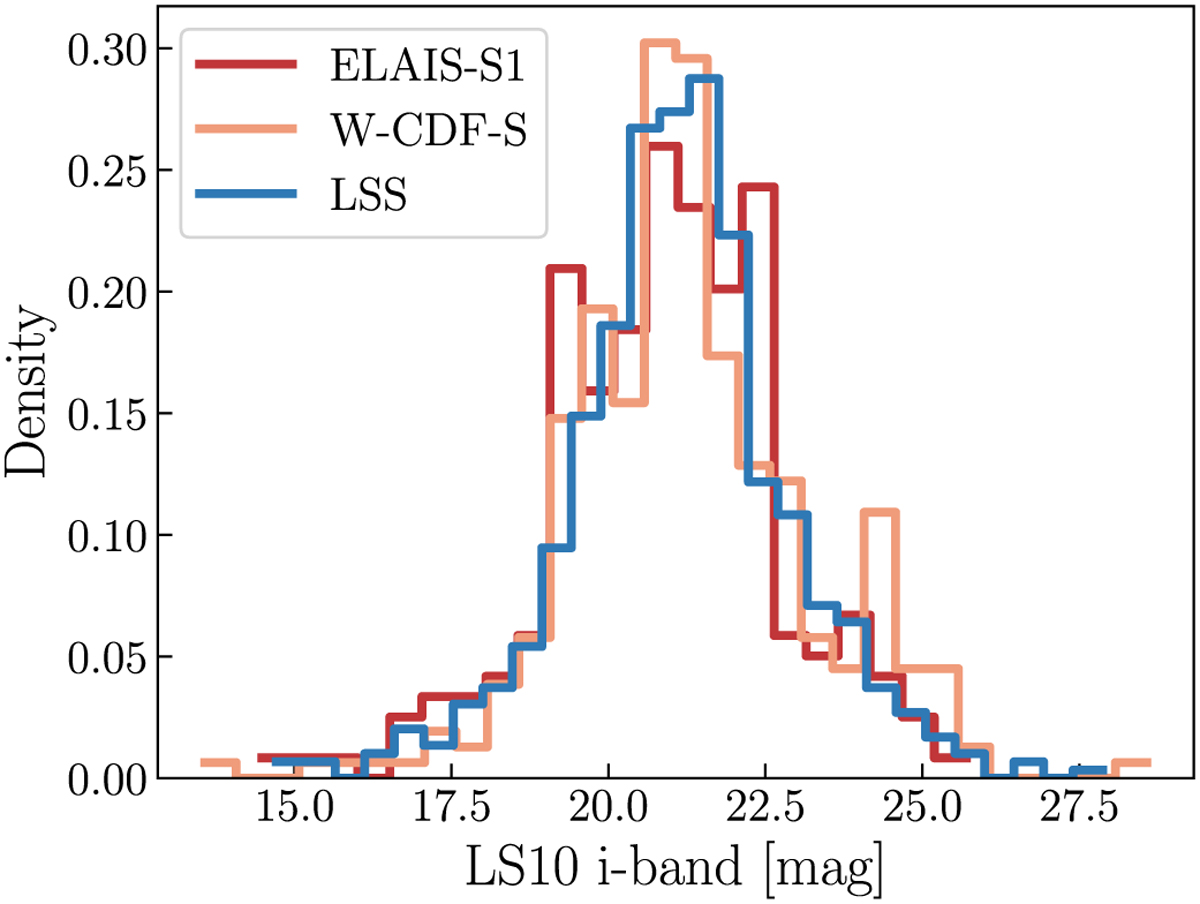
Histograms of LS10 i-band magnitudes for the three XMM-SERVS subsamples: ELAIS-S1, W-CDF-S, and LSS. The magnitudes are displayed as normalized densities to allow for direct comparison across the fields. These distributions extend to fainter magnitudes than those shown in Figure 15, accounting for the increased ηP denoted in Table 4. As the depth reached in PICZL’s LS10 training set is limited toward brighter magnitudes, a direct comparison between subsamples is only valid when conducted within a controlled parameter space, as shown in Figure 13.
Current usage metrics show cumulative count of Article Views (full-text article views including HTML views, PDF and ePub downloads, according to the available data) and Abstracts Views on Vision4Press platform.
Data correspond to usage on the plateform after 2015. The current usage metrics is available 48-96 hours after online publication and is updated daily on week days.
Initial download of the metrics may take a while.