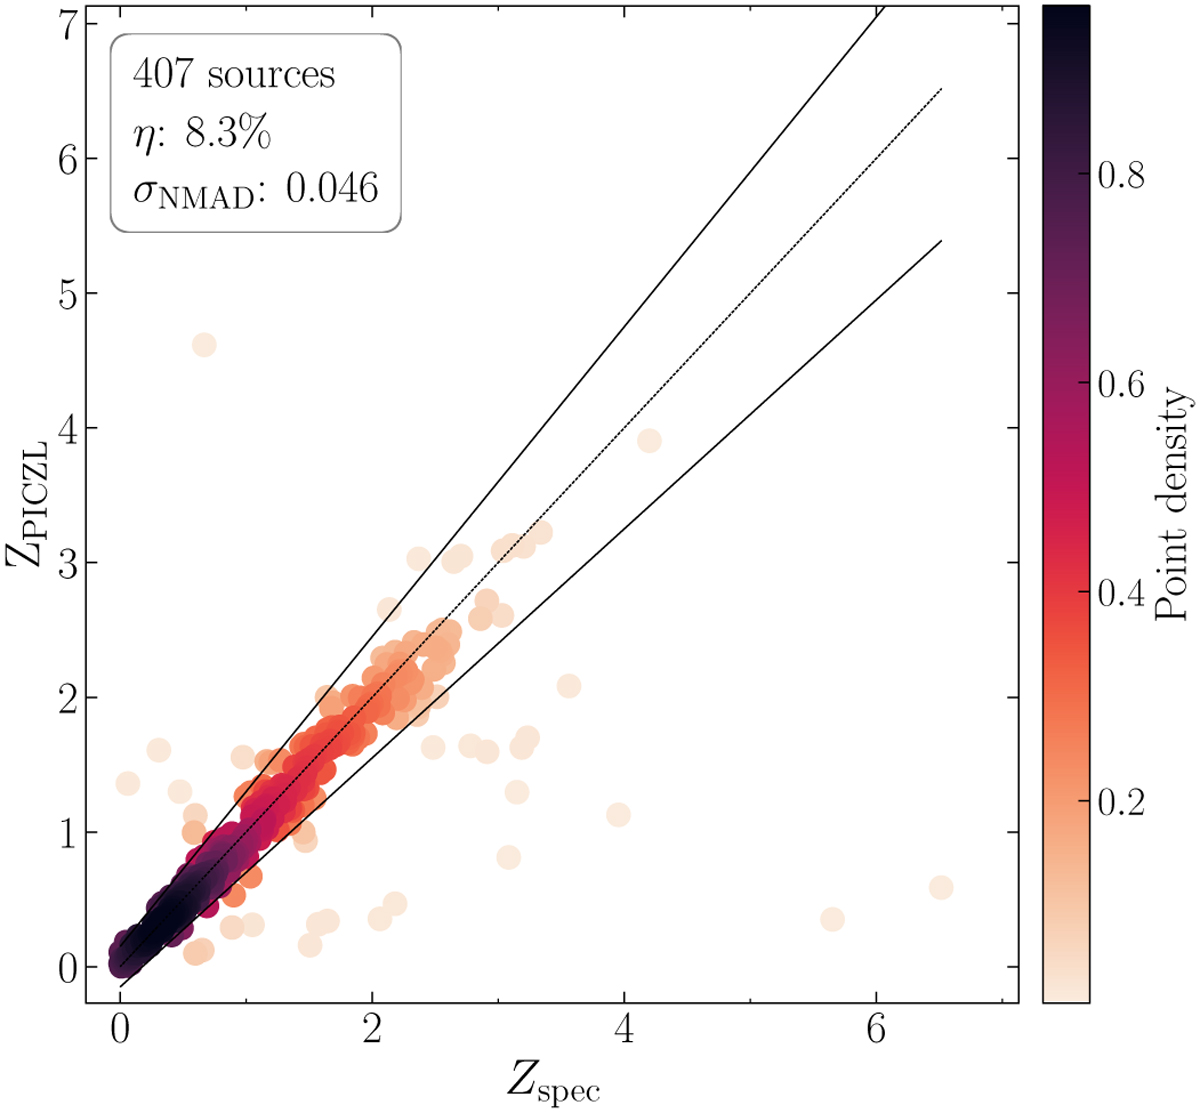
Fig. C.1
Download original image
Scatter plot of the CSC2 sample color-coded by point density, illustrating the performance of PICZL on previously unseen data, as the majority of sources lie within the defined outlier boundary, demonstrating the prediction robustness. Sources identified as outliers generally scatter close to the boundary, with only a few instances of significant deviations or catastrophic failures.
Current usage metrics show cumulative count of Article Views (full-text article views including HTML views, PDF and ePub downloads, according to the available data) and Abstracts Views on Vision4Press platform.
Data correspond to usage on the plateform after 2015. The current usage metrics is available 48-96 hours after online publication and is updated daily on week days.
Initial download of the metrics may take a while.