Open Access
Fig. 15
Download original image
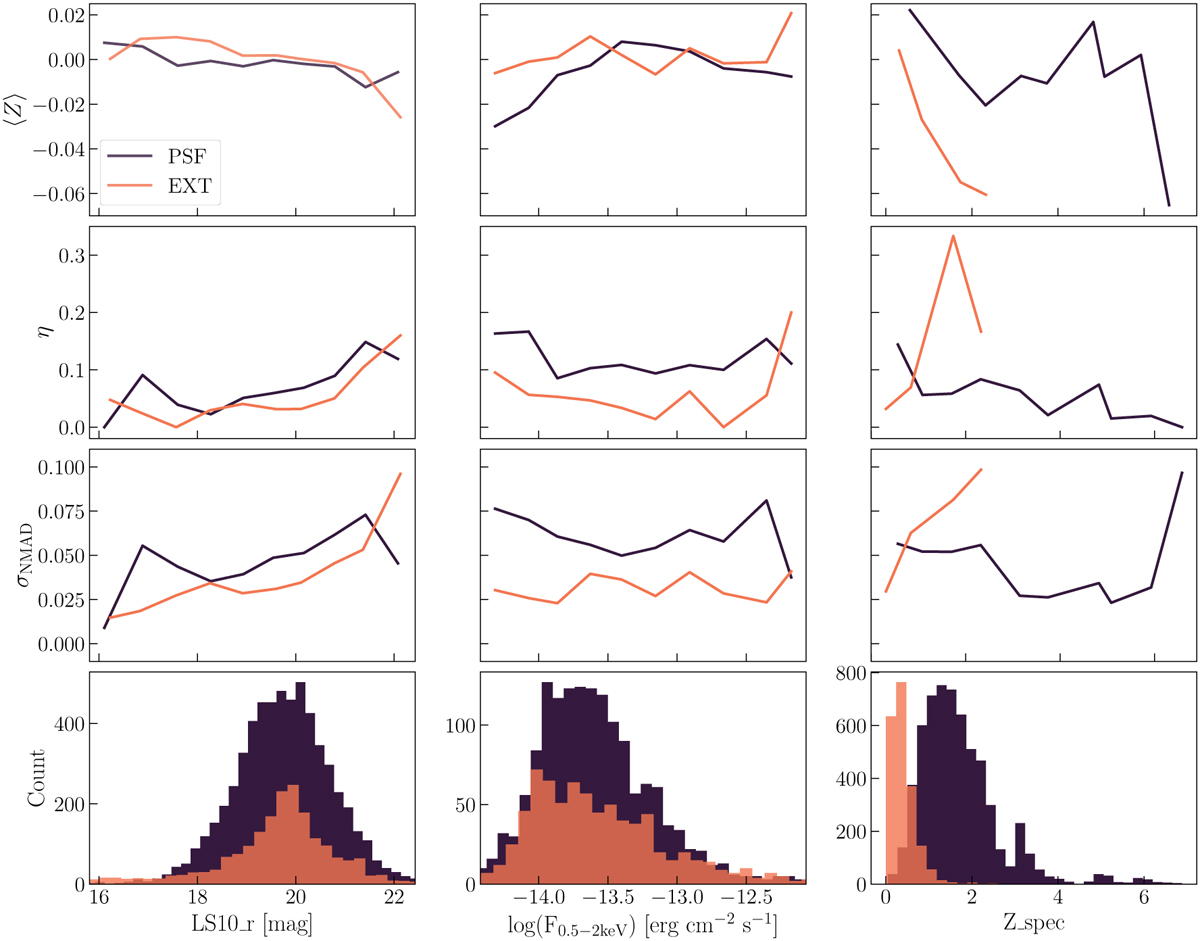
Prediction bias (top row), fraction of outliers (second row), variance (third row), and number count (fourth row) as a function of magnitude (r-band from LS10), 0.2–2.3 keV X-ray flux, and spec-ɀ, categorized by type (extended (EXT)/point-like (PSF)).
Current usage metrics show cumulative count of Article Views (full-text article views including HTML views, PDF and ePub downloads, according to the available data) and Abstracts Views on Vision4Press platform.
Data correspond to usage on the plateform after 2015. The current usage metrics is available 48-96 hours after online publication and is updated daily on week days.
Initial download of the metrics may take a while.