Fig. 11
Download original image
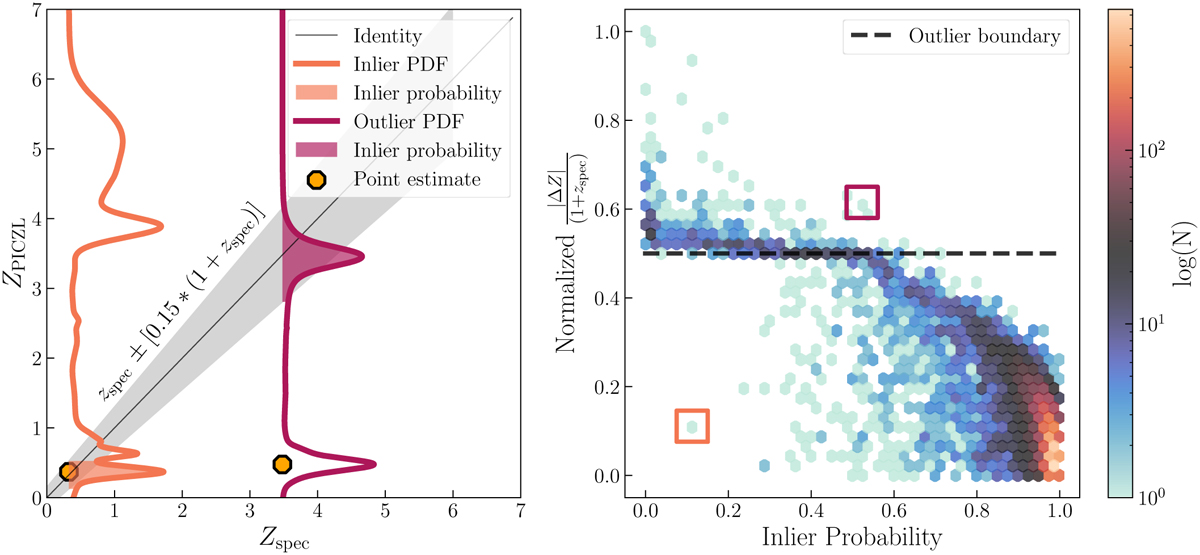
Examples of an inlier (orange) and an outlier (purple) PDF (left panel). By definition, the point estimate derived for the two sources from the main mode falls within or outside the grey shaded region. Both sources show a secondary peak in the PDF. We can define the probability of being an inlier (colored area under the PDF which coincides with the grey shaded area). Normalized ![]() as a function of inlier probability, color-coded by number density (right panel). The majority of the inliers have a high inlier probability, indicating the stability of our results (see main text for details).
as a function of inlier probability, color-coded by number density (right panel). The majority of the inliers have a high inlier probability, indicating the stability of our results (see main text for details).
Current usage metrics show cumulative count of Article Views (full-text article views including HTML views, PDF and ePub downloads, according to the available data) and Abstracts Views on Vision4Press platform.
Data correspond to usage on the plateform after 2015. The current usage metrics is available 48-96 hours after online publication and is updated daily on week days.
Initial download of the metrics may take a while.