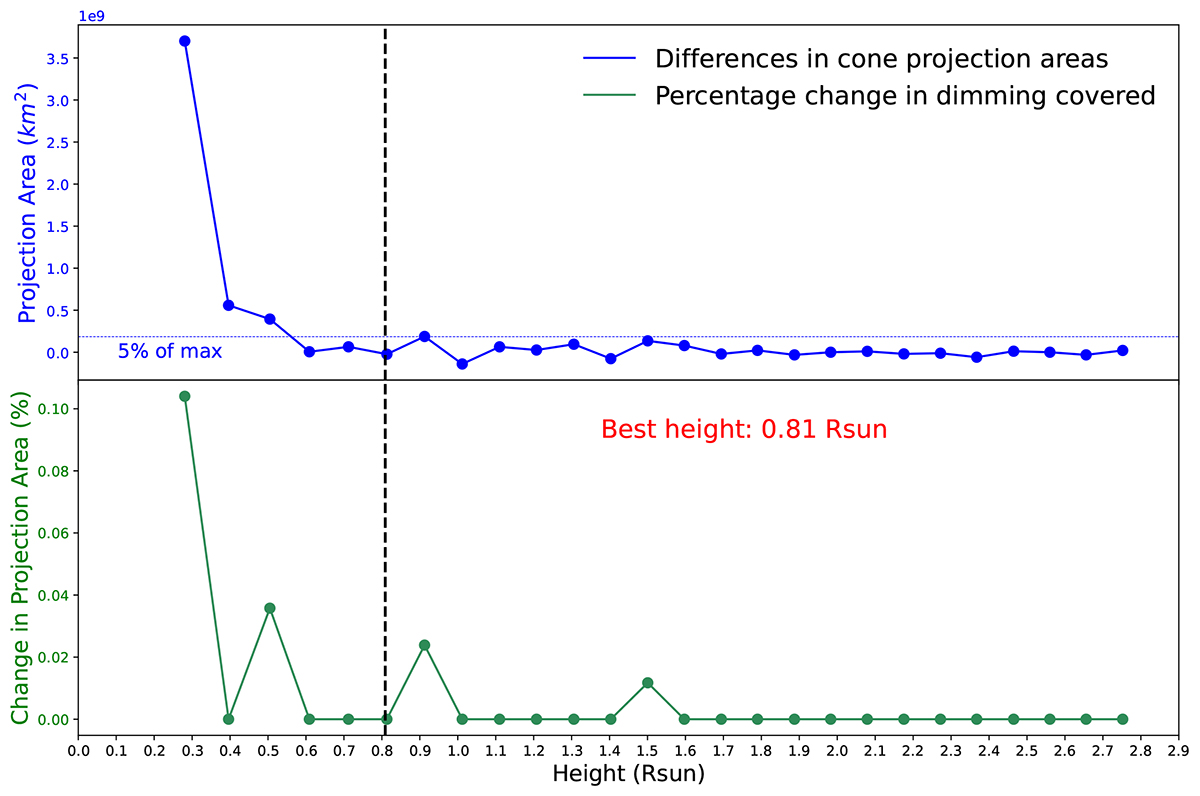
Fig. 4.
Download original image
Consecutive differences of the cone projection areas AΔh1, 2 defined by Eq. (1) (blue line, top panel) and the percentage of the relative change in the dimming area inside the projection area for consecutive cones (green line, bottom panel) for the May 8, 2024, event. The vertical dashed line indicates the step (associated with a cone height of 0.81 Rsun, a width of 69.8°, and an inclination angle of 7.7°) where the consecutive differences (blue line) reach 5% of the maximum of the cone projection area and just before the increase in percentage of the relative change in the dimming area within the projections (green line).
Current usage metrics show cumulative count of Article Views (full-text article views including HTML views, PDF and ePub downloads, according to the available data) and Abstracts Views on Vision4Press platform.
Data correspond to usage on the plateform after 2015. The current usage metrics is available 48-96 hours after online publication and is updated daily on week days.
Initial download of the metrics may take a while.