Fig. 10.
Download original image
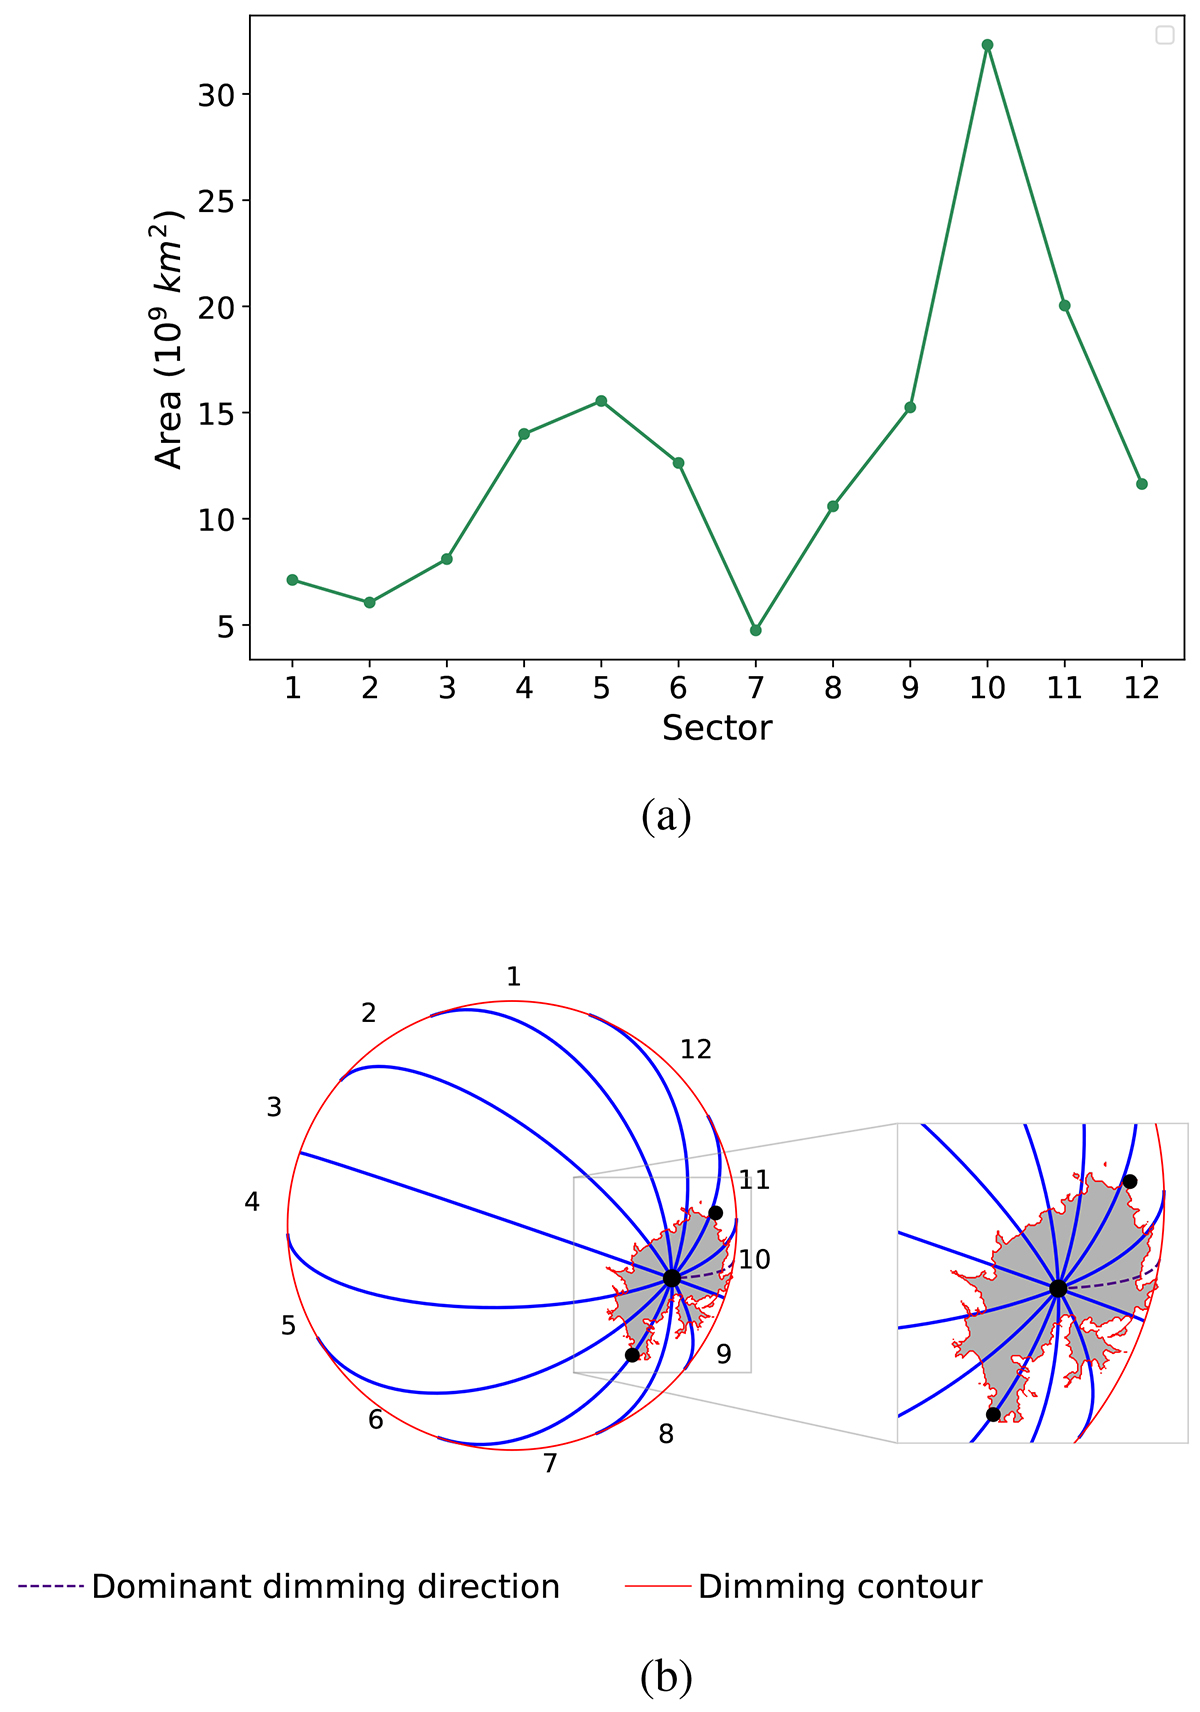
Dominant direction of the dimming expansion at the end of the impulsive phase for June 8, 2024. Top: Dimming area in the different sectors (shown in the bottom panels), showing its maximum in sector 10. Bottom: Cumulative dimming pixel mask outlined in gray with red contours. The blue lines indicate the 12 sectors. The dashed purple line gives the sector of the dominant dimming development. The small black dots show the dimming edges at the farthest edges from the source (one of them in sector 11 and other in sector 6), which were used to generate the 3D CME cones at different heights, associated widths, and inclination angles.
Current usage metrics show cumulative count of Article Views (full-text article views including HTML views, PDF and ePub downloads, according to the available data) and Abstracts Views on Vision4Press platform.
Data correspond to usage on the plateform after 2015. The current usage metrics is available 48-96 hours after online publication and is updated daily on week days.
Initial download of the metrics may take a while.