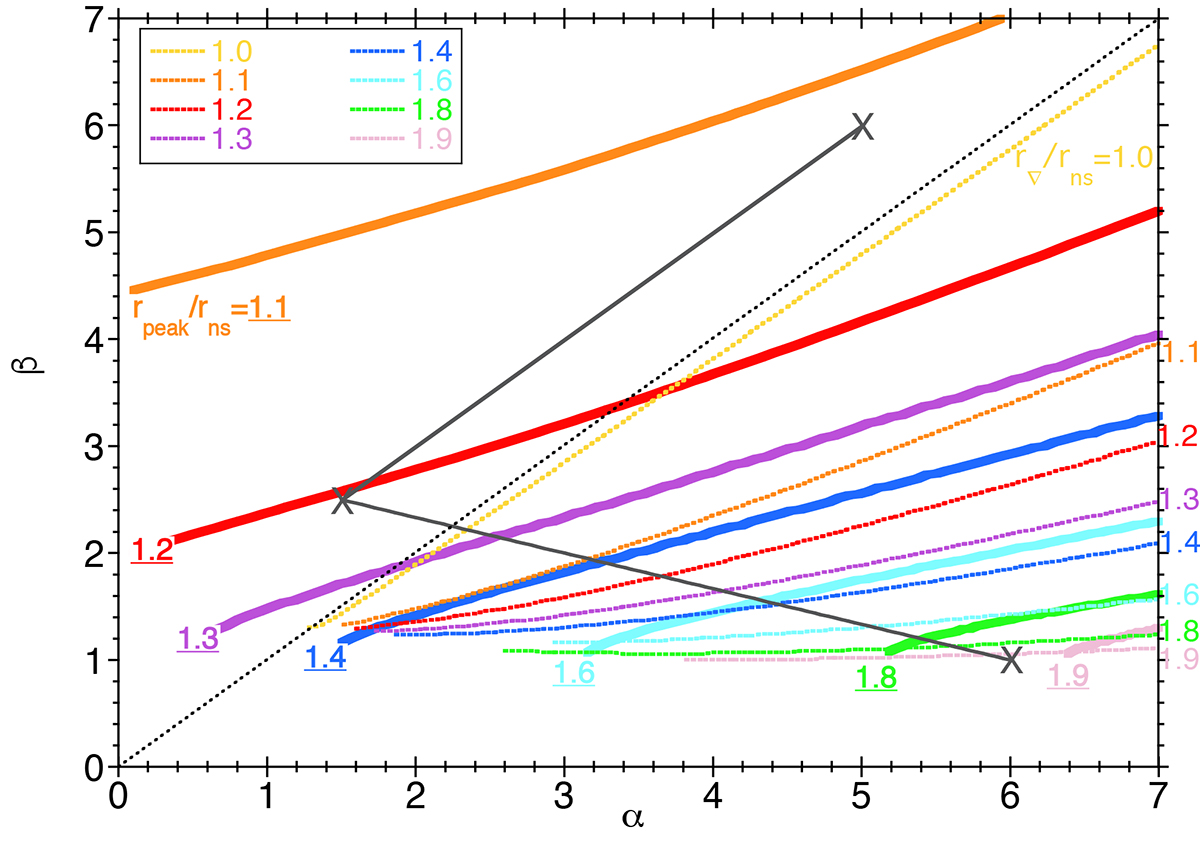
Fig. 1.
Download original image
Ratios rpeak/rns (thick solid lines) and r∇/rns (thin dotted lines) depending on the coefficients (α, β) that define the cooling function in Eq. (1). The contour lines are calculated for γ = 4/3 in spherical geometry, with rsh/rns = 10, without dissociation (ε = 0). The values of rpeak/rns and r∇/rns are indicated with the same colour code. The cooling parameters (α, β) = (3/2, 5/2), (6, 1) and (5, 6) used in Fig. 3 are indicated with crosses for reference and are connected by grey lines. The black dotted line marks the threshold β = α above which the advection time from rpeak to rns is finite and r∇ = rns.
Current usage metrics show cumulative count of Article Views (full-text article views including HTML views, PDF and ePub downloads, according to the available data) and Abstracts Views on Vision4Press platform.
Data correspond to usage on the plateform after 2015. The current usage metrics is available 48-96 hours after online publication and is updated daily on week days.
Initial download of the metrics may take a while.