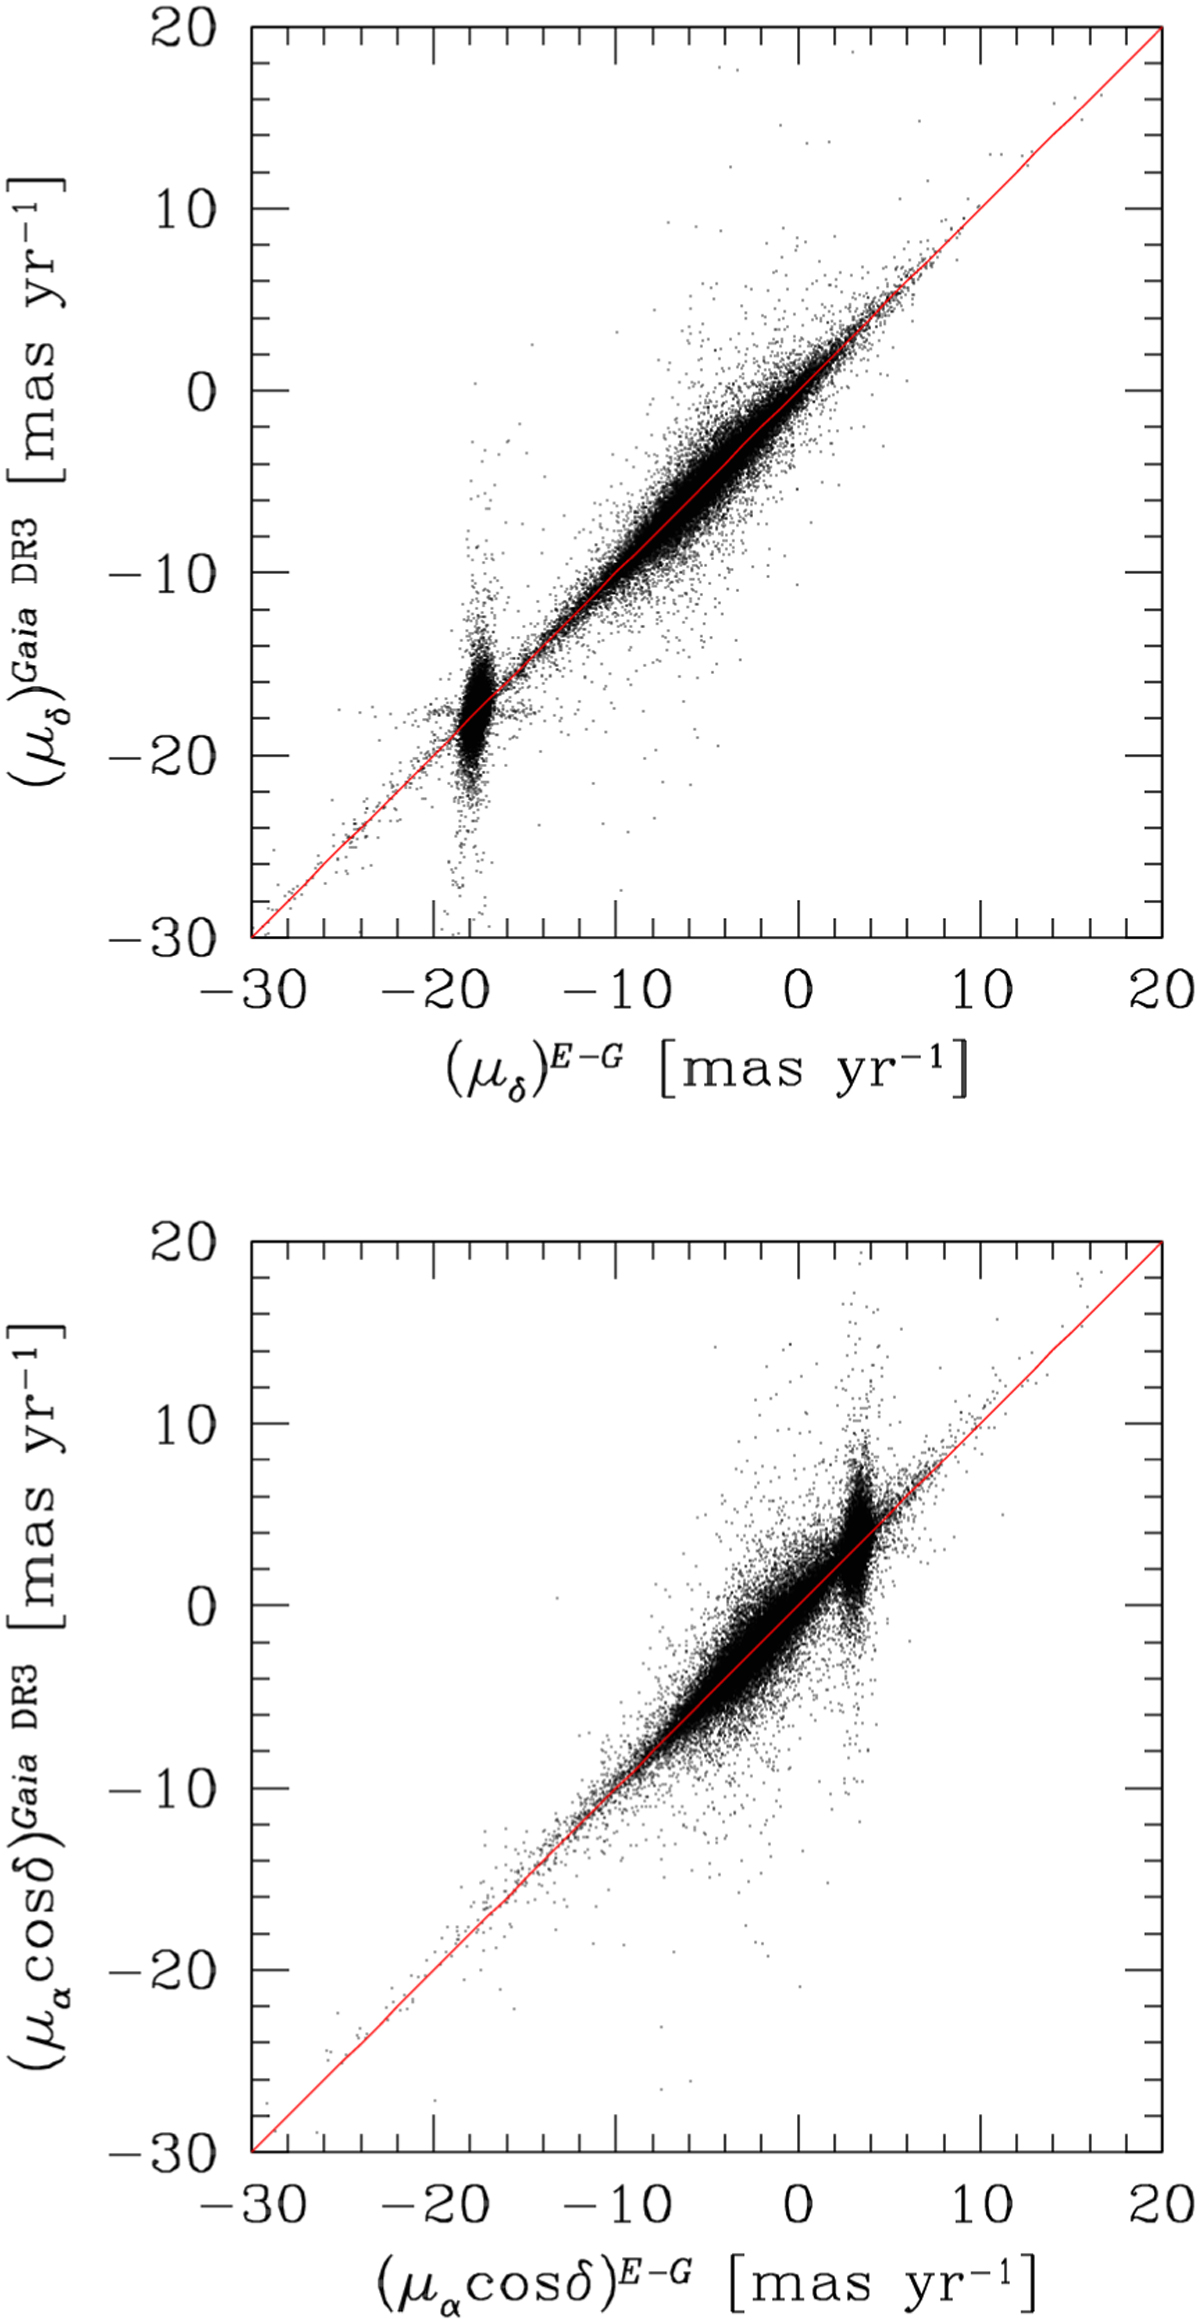
Fig. 9
Download original image
Comparison between the two components of the PMs in the Gaia DR3 and our E-G catalogue. All unsaturated stars in common with a PM measurement are shown. The red line in each panel is the fit to the points (and not the bisector of the plot) and highlights the nice agreement between the two sets of PMs. The broad distribution along the y axis is a proxy of the systematics errors in the Gaia DR3 PMs for the faint stars in common with the Euclid data.
Current usage metrics show cumulative count of Article Views (full-text article views including HTML views, PDF and ePub downloads, according to the available data) and Abstracts Views on Vision4Press platform.
Data correspond to usage on the plateform after 2015. The current usage metrics is available 48-96 hours after online publication and is updated daily on week days.
Initial download of the metrics may take a while.