Fig. 8
Download original image
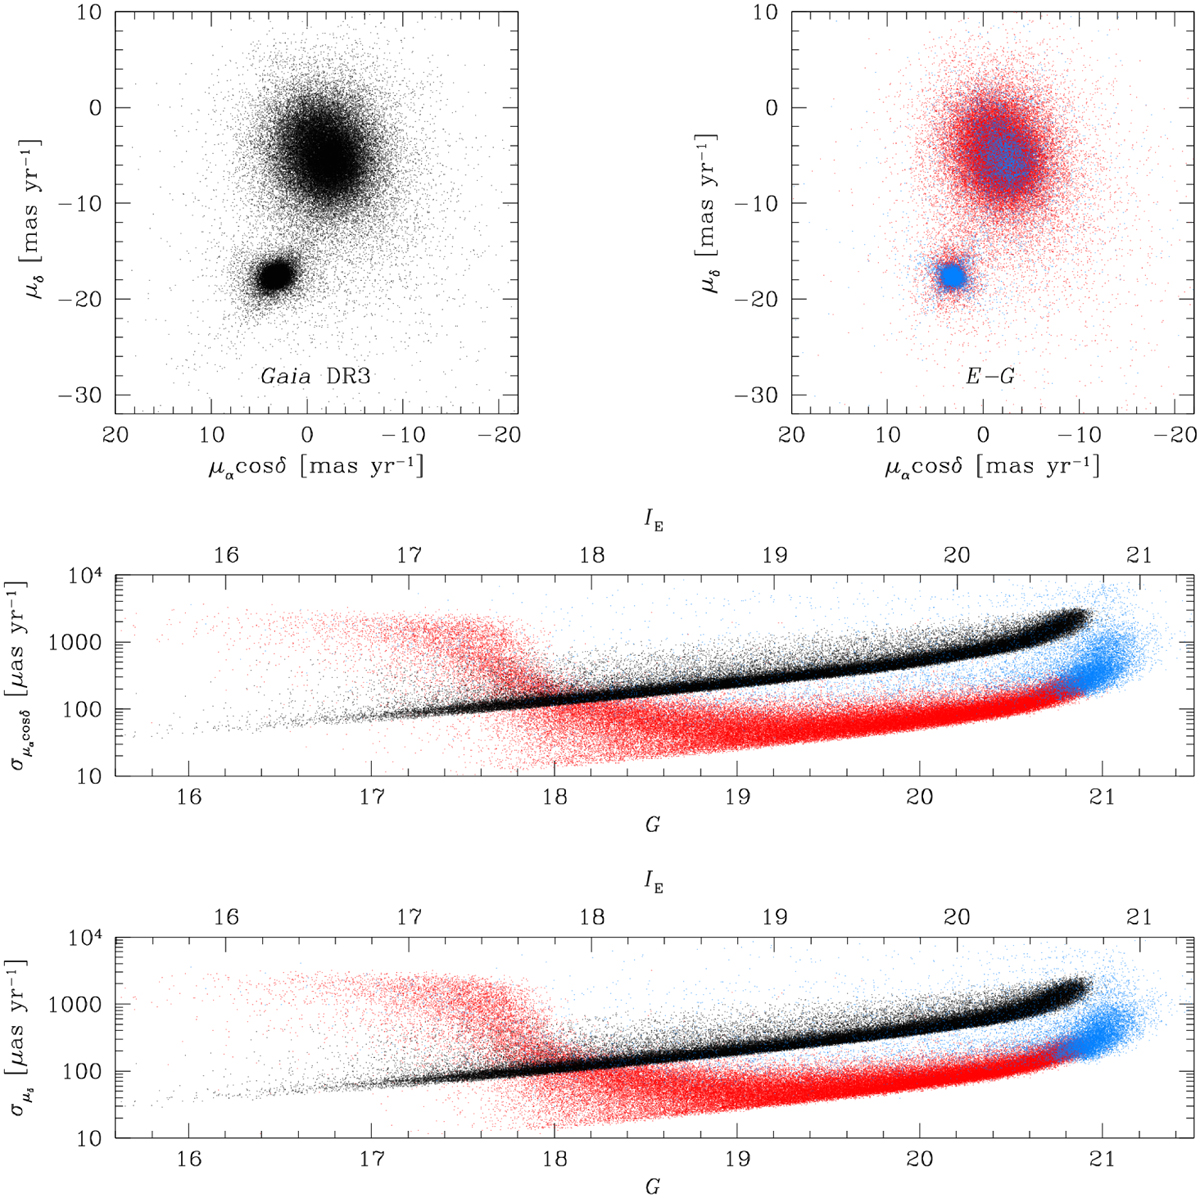
Comparison between the Gaia and Euclid-Gaia, hereafter E-G, astrometry. The two VPDs at the top present the Gaia DR3 (left panel) and E-G (right panel) PMs. Objects in common between the two catalogues are shown in black or red, depending on the panel. Blue points are stars with a two-parameter astrometric solution in Gaia (i.e. no PMs in the DR3) and an E-G PM estimate. The middle and bottom panels show the PM errors along α cos δ and δ as a function of G magnitude in the Gaia DR3 (black points) and E-G (red and blue points) catalogues. The increase of the E-G PM errors from IE ≲ 18.8 is related to saturation and poorly measured objects in the VIS exposures.
Current usage metrics show cumulative count of Article Views (full-text article views including HTML views, PDF and ePub downloads, according to the available data) and Abstracts Views on Vision4Press platform.
Data correspond to usage on the plateform after 2015. The current usage metrics is available 48-96 hours after online publication and is updated daily on week days.
Initial download of the metrics may take a while.