Open Access
Fig. 4
Download original image
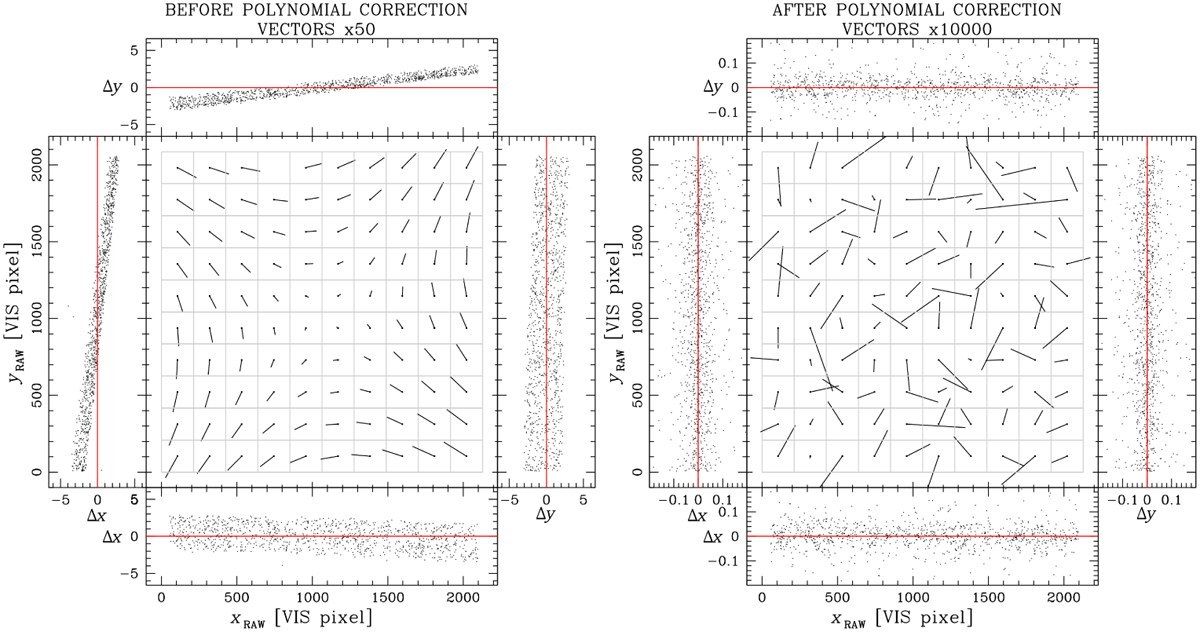
GD maps for the VIS quadrant 1-1.E before (left panel) and after (right panel) applying the polynomial correction. Vectors are magnified by a factor of 50 (left) and 10 000 (right) to enhance the details. The positional x and y positional residuals as a function of x and y raw VIS positions are shown in the side panels.
Current usage metrics show cumulative count of Article Views (full-text article views including HTML views, PDF and ePub downloads, according to the available data) and Abstracts Views on Vision4Press platform.
Data correspond to usage on the plateform after 2015. The current usage metrics is available 48-96 hours after online publication and is updated daily on week days.
Initial download of the metrics may take a while.