Fig. 11
Download original image
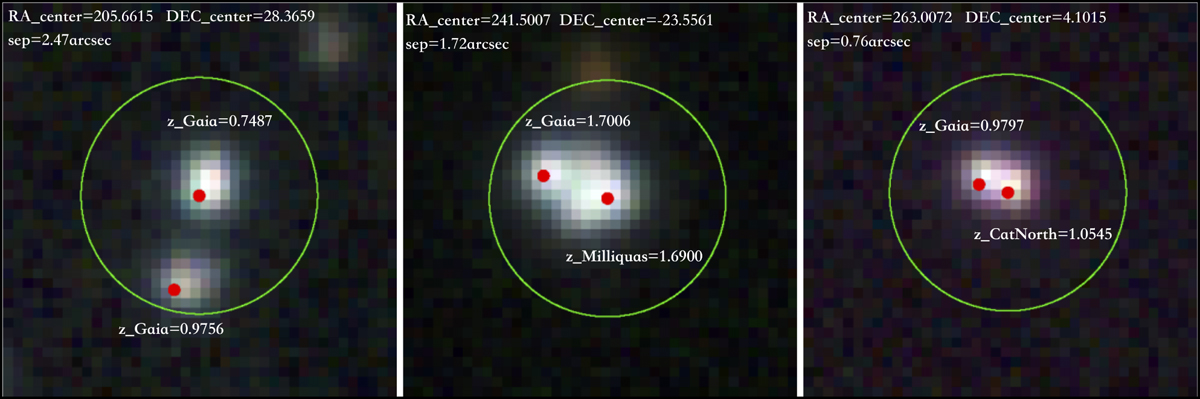
PS1 composite color images of three pairs in the Golden sample. The images were obtained by overlaying the i, r, and g bands of PS1, which were set to red, green, and blue, respectively. The size of each cutout is 10″ × 10″. The coordinates of the image centers, the projection separations of the components, and the reference redshift of each component are indicated in the images. The red dots represent the coordinates of the components in Gaia, and the green circles have a radius of 3″.
Current usage metrics show cumulative count of Article Views (full-text article views including HTML views, PDF and ePub downloads, according to the available data) and Abstracts Views on Vision4Press platform.
Data correspond to usage on the plateform after 2015. The current usage metrics is available 48-96 hours after online publication and is updated daily on week days.
Initial download of the metrics may take a while.