| Issue |
A&A
Volume 682, February 2024
|
|
|---|---|---|
| Article Number | L15 | |
| Number of page(s) | 10 | |
| Section | Letters to the Editor | |
| DOI | https://doi.org/10.1051/0004-6361/202348888 | |
| Published online | 13 February 2024 | |
Letter to the Editor
Searching for pairs of actively accreting supermassive black holes in the Gaia FPR GravLens catalog
Université Côte d’Azur, CNRS, Observatoire de la Côte d’Azur, Laboratoire Lagrange, Boulevard de l’Observatoire, CS 34229, 06304 Nice Cedex 4, France
e-mail: This email address is being protected from spambots. You need JavaScript enabled to view it.
Received:
8
December
2023
Accepted:
27
January
2024
Abstract
Observational data on dual supermassive black holes (SMBHs) are scarce, even though they should be common according to the current hierarchical formation model for galaxies. We present hereby a method to detect such dual systems, involving an already known quasar, as two luminosity peaks with angular separations smaller than one arcsecond (1″). It is based on the analysis of the spatial distribution of the Gaia data delivered in the Focused Product Release (FPR), that published for the first time detections made by Gaia at the epoch level. This approach relies on the selection of elongated spatial distributions of epoch measurements, due to two clumps of detections, checked against images coming from the PanSTARRS1 and 2MASS surveys. We have analyzed the 3.8 million of quasars flagged as single in the Gaia FPR extra-galactic table and we currently end up with only 8 dual AGN candidates, applying very conservative thresholds. G-band magnitude of each of the two luminosity peaks is provided for these candidates. The mean value of the angular separation between these two components is found to be equal to 0.3″. This demonstrates the ability of Gaia epoch data to detect previously unknown dual sources, which might be compact dual AGN.
Key words: methods: data analysis / galaxies: active / quasars: general
© The Authors 2024
 Open Access article, published by EDP Sciences, under the terms of the Creative Commons Attribution License (https://creativecommons.org/licenses/by/4.0), which permits unrestricted use, distribution, and reproduction in any medium, provided the original work is properly cited.
This article is published in open access under the Subscribe to Open model. This email address is being protected from spambots. You need JavaScript enabled to view it. to support open access publication.
1. Introduction
The broad consensus established in the study of massive galaxies today is that these galaxies must contain a supermassive black hole (SMBH) in their center, with a mass of about 106 − 109 M⊙. This SMBH is thought to form and evolve through mergers alongside the hierarchical formation of its host galaxy, which is expected to experience a few massive mergers in one Hubble time, during which the individual SMBH of each parent galaxy is also thought merge at some point (Heahnelt & Kauffmann 2002). The observed correlation between the SMBH masses and bulge masses of the host galaxy, highlighted by Schutte et al. (2019), is viewed as the consequence of a direct link between the growth of galaxies and the growth of their central SMBH. Even if these two processes are studied in cosmological simulations (Volonteri et al. 2022), we currently lack observational information that could help us to place constraints on them, such as dynamical friction delays or the expected timescales between the galaxy merger and the SMBH merger, according to the masses of the initial SMBHs (Li et al. 2021), for instance. The existence of an SMBH pair resulting from a galaxy merger event before its gravitational bound as a binary and its final coalescence is therefore a solid prediction of the theoretical galaxy formation model. Nevertheless, detecting these systems clearly is a challenge. A way to directly observe them is to search for their counterparts emitting light, the so-called active galactic nuclei (AGN). However, only a few candidate double systems are currently reported, with separations of about a few dozen kiloparsec (Rosario et al. 2011; Rubinur et al. 2019; Gabányi et al. 2016; Foord et al. 2020; Comerford et al. 2012). We hereafter pay particular attention to pairs of AGN within the same host galaxy (dual systems), with smaller separations, as are expected to be found at some stage of a major galaxy merger.
The study of a large enough sample of these dual systems is very useful to test theories that aim to explain the correlation between masses. Many of the underlying physical processes and related parameters are also still poorly determined. The migration speed of the two SMBHs following a galaxy merger, for instance, is still debated, as is the impact of these mergers on the star formation rate (Volonteri et al. 2022; Li et al. 2021). Determining a lower bound on the actual number of these dual systems is also important regarding the duty cycle of AGN, the processes triggering the activity of the SMBH and its impact on the host galaxy: stellar population (Krumholz & McKee 2005), heating and ejection of ambient gas (Cattaneo et al. 2009), cooling flows, and jet feedbacks (Croton et al. 2006).
The SMBHs related to these dual AGN within the same galaxy are thought merge later on and to then emit gravitational waves. This offers us a new way to probe the hierarchical mass build-up of galaxies using the future space gravitational wave observatory of the European Space Agency (ESA), which is planned to be launched in 2037: the Laser Interferometer Space Antenna (LISA) (Klein et al. 2016). Access to a realistic number of dual AGN would then help us to estimate the expected number of low-frequency gravitational wave emitters related to the merger of BHs with masses between 109 − 1010 M⊙ (Franciolini et al. 2023).
Our ability to detect these dual systems chiefly depends both on the spatial resolution capability of the instrument used and on the surveyed area of the sky. Techniques pairing a large sample of objects with high resolution are then required. The ESA Gaia space mission is the first all-sky survey with a subarsecond spatial resolution (Gaia Collaboration 2016). It is therefore particularly interesting for a study like this. In October 2023, ESA released a complementary catalog of the Gaia Data Release 3 published in 2022 (Gaia Collaboration 2022), referred to as the focused product release (FPR). Part of this release involves a search for lensed quasars that are of prime interest for cosmological studies. The results of this study presented in the extragalactic lens tables contains all sources and epoch observations detected in a radius of 6 arcsec around 3.8 million known and candidate quasars (Gaia Collaboration 2023). The epoch information, such as the positions and the fluxes, is not the fully calibrated. These will be published in the next data releases of Gaia, but are issued from a preprocessing pipeline of Gaia called image parameter determination (IPD). The information of the number of objects (called components in Gaia Collaboration 2023) around each quasar is provided.
Using the epoch information for quasars, we can determine whether some objects that are considered as single in the Gaia FPR catalog correspond in fact to two or more close but separated structures. To test this hypothesis, we built a method for analyzing the clustering properties of these Gaia epochs with an unmatched angular resolution, and we present the first results we obtained. Section 2 of this Letter presents the data of the FPR catalog and the subset we used. Section 3 explains the method we developed. Our results are provided in Sect. 4. The perspectives and conclusions of our work are presented in Sect. 5.
2. The Gaia focused product release data
The Gaia epoch detections correspond to the position of the object determined when transiting on the Gaia focal plane (Gaia Collaboration 2016). We considered that the spatial distribution of these positions reflects the actual surface brightness distribution of the object. For a single source, such as a star or a quasi-stellar object (QSO), the set of these positions must correspond to a well-defined single clump of measurements with a dispersion related to the observational accuracy for this luminosity and surface brightness. A distribution with multiple peaks contains valuable information about the structure or the multiplicity of the source, or about its photocenter displacement. The recent release of the Gaia FPR catalog grants us access to these epoch positions for its entries.
Analyzing the Gaia FPR catalog on quasars to search for previously undetected dual sources, we only selected objects that are flagged as single in their catalog entry (i.e., we extracted all sources in gaiafpr.lens_candidates with n_components equal to one) and collected the gaiafpr.lens_observations and gaiafpr.lens_outliers1. For these entries, the spatial dispersion of the epoch positions has therefore been found to be small enough for the clustering code applied in the Gaia data reduction pipeline to end up with this conclusion. This clustering code depends on a minimum separation between points to consider them as belonging to two different clusters2, and part of these single entries could therefore exhibit smaller but real substructures. The spatial distributions of the objects can be analyzed in this way to check for heterogeneities that may be linked to two separated but very close clumps of epoch positions.
To prevent any bias in the observed spatial distribution of the detections, the homogeneity of the angular sampling of the object by the Gaia transits has to be checked to remove objects with uneven samplings. During the whole mission, Gaia scans the sources through different angles (due to the nominal scanning law) at each transit, assigning a window centered on the observed source at each epoch. The angular coverage of a source is calculated as the ratio of the area of the polygon formed by the combination of observed windows at all epochs to the area of a circle with a diameter equal to the diagonal of the largest observed window. However, the information concerning the angular coverage of the objects is not published in Gaia DR3 or FPR. The only information available is that the quasars studied in Ducourant et al. (2023) have an angular coverage of at least 85%. Therefore, we only used the entries for which we are confident in the proper sampling of Gaia. This limitation decreases the number of objects in our study to a total of 887 424 quasars that were obtained by cross-matching the FPR lens catalog of one-component objects with the Gaia DR3 gaiadr3.qso_candidates table in which morphology information is published.
3. Method
To devise a method for distinguishing close light sources inside the same galaxy, we made the hypothesis that the object listed in the Gaia FPR lens catalog as a single AGN entry might originate from two close sources that might be spatially resolved by Gaia. These two separate sources should result in an asymmetry in the spatial distribution of the Gaia epoch detections, and this distribution should be more elongated alongside the line linking the two sources. By fitting an ellipse to the numerical density of these detections, we must then be able to identify objects that exhibit an elongated distribution of these coordinates. This ellipse statistically covers 68% of the considered spatial density, and its basic parameters (center, position angle, major axis, and elongation) have been computed as usual from the first- and second-order moments of the distribution (Stobie 1980). Tests performed on simulated data showed us that the values of these parameters can be recovered with errors lower than 10%, providing a number of measurements larger than 20.
To select asymmetric sources, we applied a threshold on the ellipticity parameter e, defined as the ratio of the minor axis B over the major axis A of the fitted ellipse. This threshold is based on the distribution of the observed values, which shows a Gaussian shape with a long tail of low ellipticities. For this first attempt to select entries with at least two aligned components, we arbitrarily set this threshold to e = 0.2. This value corresponds to a major axis equal to five times the spatial dispersion expected for the isotropic Gaia epoch data, which might be caused by a combination of the intrinsic motion of the photocenter of the object, if any, and the observational detection noise of Gaia. It is also equal to half the separation expected between two quasars after 10 yr of Gaia observations if their proper motions are perpendicular and stand between 1 and 10 mas yr−1. Applying this criterion, slightly fewer than 80 000 objects were selected. We also applied a cut on the luminosity of the sources in order to reject the brightest entries, which are often affected by interpolation with bright diffraction spikes of stars, leading to ellipticities with erroneous high values. We therefore decided to only keep objects fainter than G = 16 mag. For a meaningful analysis of the clustering properties of the observations associated with a single entry, which is necessary to detect a dual AGN, a high enough number of these observations is also required. After verifying that the values of the elliptical parameters modeling the spatial distributions of the epoch positions are correct enough when at least 20 positions are involved, we decided for this morphological analysis to set up a higher threshold, equal to 30 positions, in order to secure its outcome. When we applied these thresholds on the elongation, luminosity, and number of measurement, only 3335 sources (out of ≈880 000) were left to further search for heterogeneities in the spatial distribution of the Gaia detections.
We sought to differentiate two cases: Either the spatial distribution of Gaia detections is elongated but homogeneous, or it is elongated as the result of the existence of several clumps of positions very close to each other. To detect these clumps of detections, we applied the Pyfof3 friends-of-friends clustering algorithm4 to the data. Based on multiple tests on real data, which exhibit an average value of 50 mas for the standard deviation of the spatial distribution of epoch positions, we set the value of the clustering length parameter to 30 mas. With this setting, it appears that our clustering analysis mostly leads to the identification of one large component surrounded by few others, composed of three or fewer individual detections. These small components can be considered as outliers, and we decided to discard them when evaluating the spatial structure of the detection distribution. Very few entries of our subsample were classified as a compact double-source candidate. To visually secure this status and verify that the candidate was indeed related to one single host galaxy, we decided to display the distribution of the Gaia detections of these few cases overplotted on images from the Two Micron All-Sky Survey (2MASS) and Panoramic Survey Telescope And Rapid Response System (PanSTARRS1) surveys.
4. Results
When we applied the method described above with its different thresholds, most of the 3335 selected objects with a large elongation appeared to correspond to a unique large clump of detections with some outliers, depending on the case. Only 57 objects were found to exhibit an internal substructure, with at least 7 detections for each component in the current sample. Moreover, the secondary components of this very small subset most of the time appear to be unphysical for galaxies with regular 2D surface brightness distributions: a ring of detections around a compact clump, or a second component with a too large spatial dispersion, or many close outliers considered as a single component. However, eight of these objects passed all the checks, including this visual inspection over the galaxy images. These eight candidates can therefore be classified as object sexhibiting a double internal structure at a high confidence level: Their detections are displayed in Figs. A.1–A.8, respectively, and they are overplotted on the corresponding galaxy images from the 2MASS or PanSTARRS1 surveys in Figs. B.1–B.8, respectively. We consider these eight objects to be dual AGN candidates.
From the individual measurements related to each detection, we computed the angular separation between the barycenters of each component and their mean magnitude. These parameters, as well as the number of detections for each component, are displayed in Table 1, along with part of their source ID.
Physical parameters for our eight dual AGN candidates.
The mean magnitude in the G band is 19.3 mag. The angular separations are found to be about 0.3″, with the lowest value being 0.13″. Moreover, the angular coverage ratios for these eight objects are higher than 85%, according to Ducourant et al. (2023), which means that the spatial distribution of the detections is surely representative of the surface brightness distribution of the real source at high angular resolution. Only two of the eight objects selected as dual AGN candidates have known redshifts in Gaia DR3, one with z = 0.1 and the other with z = 2.3. Considering that all our candidates have redshifts within this range, we obtained physical separations between the components of each pair of between 0.3 and 3.4 kpc, which is similar to previous observations of dual AGN (Comerford et al. 2012).
5. Discussion and perspectives
For very compact internal substructures in the Gaia entries, the average value of the angular separation between the barycenters of the two components for the eight objects we selected is lower than the value related to the parameter used to flag as multiple an object on the fly when Gaia scans the sky. This parameter (ipad_frac_multi_peak in Gaia DR35, which gives the probability of having several peaks in the scanning window), was used in Ciurlo et al. (2023) to identify dual AGN candidates. When Gaia EDR3 objects related to the Milliquas sources (Flesh 2021) were considered, more than 200 objects with a multi-peak fraction greater than 10% were selected in this way. To confirm part of these candidates, with a galactic latitude b ≥ |12° | and secure spectroscopic redshifts z ≥ 0.3, as genuine dual AGN and reject chance alignments with a star along the line of sight as well as rare gravitational lenses, additional spectral information was required. To date, only three of these systems are confirmed, with values for the angular separation between the components of ≈0.27″, 0.61″, 0.71″, respectively. Our method gives access to smaller separations because it directly relies on the Gaia epoch observations to identify a second luminosity peak. However, we also need to spectroscopically confirm our candidates before claiming identification of new dual AGN. Applications for observational time to this so are currently submitted.
Out of about 3300 single objects that were found to be elongated, we extracted eight dual sources, which corresponds to a fraction of 0.23% of the sample. Part of this success rate may be due to chance alignments or gravitational lenses, but we are confident that a large part of them should be related to real compact dual AGN. However, our current ratio of dual AGN candidates is much lower than was predicted from simulations, with a percentage of dual quasars of about 5 − 10% of the total sample (Volonteri et al. 2022). We also stress that this work is only a preliminary test to determine whether Gaia can resolve very close extragalactic sources, providing access to the calibrated epoch data. This study by no means claims to be exhaustive, and surely some actual double sources were discarded due to the very conservative thresholds we applied. Conversely, it might also be possible that the accuracy of the calibration of the epochs positions is not high enough for very close objects, which might sometimes lead to the observation of two separate clumps of detections where only one source is located. Increasing the number of targets for further spectroscopic follow-up is easy, but carries the risk of adding interlopers. This would require accurate methods for estimating the purity and the completeness of the output list of candidates.
A census of dual AGN that is as complete as possible is key to adding new constraints on the hierarchical formation of galaxies, the formation of their associated central SMBHs, the duty cycle of the AGN, and its impact on star formation. In this context, both the sensitivity and spatial resolution of the detector used to perform the observations are crucial factors to be able to detect close multiple luminosity peaks at the center of objects. The epoch data of the Gaia astrometry space mission and forthcoming images from the Euclid mission survey are of particular interest for this purpose. The study reported here based on Gaia data is a first attempt in this direction, restricted to the identification of the straightforward cases. It shows the potential of these high-resolution data to succeed, and we stress the importance of having access to the whole set of Gaia epoch data to perform a full-sky complete analysis and to have information about the angular coverage obtained with the Gaia sampling of the objects. Meanwhile, detecting less evident configurations in the current FPR catalog is within reach. An easy way to do this is to decrease the threshold values in our method while estimating biases. This work is in progress.
Data are downloaded from the ESA archive https://gea.esac.esa.int/archive/.
The minimum separation is set to 100 mas in the official data reduction pipeline (Gaia Collaboration 2023).
Association of an if loop and an R-tree method, used to index hierarchically multidimensional elements, accessing here spatial data, and conditionally classify points inside groups through multiples iterations, where the algorithm searches for the closest neighbors of a given point (Guttman 1984).
Fraction of Gaia transits, in any angles, in which multiple light peaks appear in the scanning window (Gaia Collaboration 2016, 2022).
Acknowledgments
This work has made use of data from the European Space Agency (ESA) mission Gaia (https://www.cosmos.esa.int/gaia), processed by the Gaia Data Processing and Analysis Consortium (DPAC, https://www.cosmos.esa.int/web/gaia/dpac/consortium). Funding for the DPAC has been provided by national institutions, in particular the institutions participating in the Gaia Multilateral Agreement.
References
- Ciurlo, A., Mannucci, F., Yeh, S., et al. 2023, A&A, 671, L4 [NASA ADS] [CrossRef] [EDP Sciences] [Google Scholar]
- Comerford, J. M., Gerke, B. F., Stern, D., et al. 2012, ApJ, 753, 42 [Google Scholar]
- Cattaneo, A., Faber, S. M., Binney, J., et al. 2009, Nature, 460, 213 [NASA ADS] [CrossRef] [Google Scholar]
- Croton, D. J., Springel, V., White, S. M. D., et al. 2006, MNRAS, 365, 11 [NASA ADS] [CrossRef] [Google Scholar]
- Ducourant, C., Krone-Martins, A., Galluccio, L., et al. 2023, A&A, 674, A11 [NASA ADS] [CrossRef] [EDP Sciences] [Google Scholar]
- Flesh, E. W. 2021, arXiv e-prints [arXiv.2105.12985] [Google Scholar]
- Foord, A., Gültekin, K., Nevin, R., et al. 2020, ApJ, 892, 29 [NASA ADS] [CrossRef] [Google Scholar]
- Franciolini, G., Iovino, A. J., Vaskonen, V., & Veermae, H. 2023, Phys. Rev. Lett., 131, 201401 [NASA ADS] [CrossRef] [Google Scholar]
- Gabányi, K. É., An, T., Frey, S., et al. 2016, ApJ, 826, 106 [CrossRef] [Google Scholar]
- Gaia Collaboration (Prusti, T., et al.) 2016, A&A, 595, A1 [NASA ADS] [CrossRef] [EDP Sciences] [Google Scholar]
- Gaia Collaboration (Bailer-Jones, C. A. L., et al.) 2022, A&A, 674, A5 [Google Scholar]
- Gaia Collaboration (Krone-Martins, A., et al.) 2023, A&A, submitted [arXiv.2310.06295] [Google Scholar]
- Guttman, A. 1984, ACM SIGMOD Record, 14, 47 [CrossRef] [Google Scholar]
- Heahnelt, M. G., & Kauffmann, G. 2002, MNRAS, 336, L61 [NASA ADS] [CrossRef] [Google Scholar]
- Klein, A., Barausse, E., Sesana, A., et al. 2016, Phys. Rev. D, 93, 024003 [NASA ADS] [CrossRef] [Google Scholar]
- Krumholz, M. R., & McKee, C. F. 2005, ApJ, 630, 250 [Google Scholar]
- Li, K., Ballantyne, D. R., & Bogdanović, T. 2021, ApJ, 916, 110 [NASA ADS] [CrossRef] [Google Scholar]
- Rosario, D. J., McGurk, R. C., Max, C. E., et al. 2011, ApJ, 739, 44 [NASA ADS] [CrossRef] [Google Scholar]
- Rubinur, K., Das, M., & Kharb, P. 2019, MNRAS, 484, 4933 [Google Scholar]
- Schutte, Z., Reines, A. E., & Greene, J. E. 2019, ApJ, 887, 2 [Google Scholar]
- Stobie, R. S. 1980, in Application of Moments to the Analysis of Panoramic Astronomical Photographs, ed. D. A. Elliott, Proc. SPIE, 264, 208 [NASA ADS] [Google Scholar]
- Volonteri, M., Pfister, H., Beckman, R., et al. 2022, MNRAS, 514, 640 [NASA ADS] [CrossRef] [Google Scholar]
Appendix A: Spatial distributions of the Gaia FPR epoch data of the eight sources considered as dual AGN candidates.
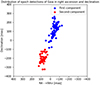 |
Fig. A.1. Spatial distribution of Gaia DR3 object 413107379 epoch positions. The maximum separation between two points of the same component is equal to 50 mas. The red points correspond to the first detected component, and the blue dots represent the second component. |
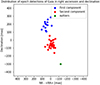 |
Fig. A.2. Spatial distribution of Gaia DR3 object 709923047 epoch positions. The maximum separation between two points of the same component is equal to 50 mas. The red points correspond to the first detected component, and the blue dots are the second component. The green points are considered too far from each other and from the computed components to be included, and they are labeled outliers. |
Appendix B: Epoch data of the eight dual AGN candidates detected, overplotted on the corresponding source image from all-sky catalogs.
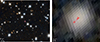 |
Fig. B.1. Gaia epochs (in red) of the DR3 object 413107379 associated with the corresponding PanSTARRS1 image. The left panel shows the surrounding of the source and the unique point in the Gaia catalog. The right panel is the zoom into the galaxy, showing the two spots of the epoch positions. The maximum separation between two points inside the same component is 50 mas. |
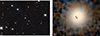 |
Fig. B.2. Gaia epochs (in red) of the DR3 object 709923047 associated with the corresponding PanSTARRS1 image. The left panel shows the surrounding of the source and the unique point in the Gaia catalog. The right panel is the zoom into the galaxy, showing the two spots of the epoch positions. The maximum separation between two points inside the same component is 50 mas. |
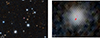 |
Fig. B.3. Gaia epochs (in red) of the DR3 object 185414449 associated with the corresponding PanSTARRS1 image. The left panel shows the surrounding of the source and the unique point in the Gaia catalog. The right panel is the zoom into the galaxy, showing the two spots of the epoch positions. The maximum separation between two points inside the same component is 50 mas. |
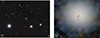 |
Fig. B.4. Gaia epochs (in red) of the DR3 object 372100463 associated with the corresponding PanSTARRS1 image. The left panel shows the surrounding of the source and the unique point in the Gaia catalog. The right panel is the zoom into the galaxy, showing the two spots of the epoch positions. The maximum separation between two points inside the same component is 40 mas. |
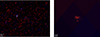 |
Fig. B.5. Gaia epochs (in red) of the DR3 object 502675674 associated with the corresponding 2MASS image. The left panel shows the surrounding of the source and the unique point in the Gaia catalog. The right panel is the zoom into the galaxy, showing the two spots of the epoch positions. The maximum separation between two points inside the same component is 40 mas. |
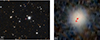 |
Fig. B.6. Gaia epochs (in red) of the DR3 object 481987315 associated with the corresponding PanSTARRS1 image. The left panel shows the surrounding of the source and the unique point in the Gaia catalog. The right panel is the zoom into the galaxy, showing the two spots of the epoch positions. The maximum separation between two points inside the same component is 30 mas. |
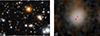 |
Fig. B.7. Gaia epochs (in red) of the DR3 object 451971551 associated with the corresponding PanSTARRS1 image. The left panel shows the surrounding of the source and the unique point in the Gaia catalog. The right panel is the zoom into the galaxy, showing the two spots of the epoch positions. The maximum separation between two points inside the same component is 30 mas. |
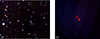 |
Fig. B.8. Gaia epochs (in red) of the DR3 object 666080784 associated with the corresponding 2MASS image. The left panel shows the surrounding of the source and the unique point in the Gaia catalog. The right panel is the zoom into the galaxy, showing the two spots of the epoch positions. The maximum separation between two points inside the same component is 30 mas. |
All Tables
All Figures
|
Fig. A.1. Spatial distribution of Gaia DR3 object 413107379 epoch positions. The maximum separation between two points of the same component is equal to 50 mas. The red points correspond to the first detected component, and the blue dots represent the second component. |
| In the text | |
|
Fig. A.2. Spatial distribution of Gaia DR3 object 709923047 epoch positions. The maximum separation between two points of the same component is equal to 50 mas. The red points correspond to the first detected component, and the blue dots are the second component. The green points are considered too far from each other and from the computed components to be included, and they are labeled outliers. |
| In the text | |
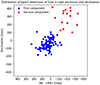 |
Fig. A.3. Same as in Fig. A.1, but for Gaia DR3 object 185414449 epoch positions. |
| In the text | |
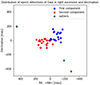 |
Fig. A.4. Same as in Fig. A.2, but for Gaia DR3 object 372100463 epoch positions. |
| In the text | |
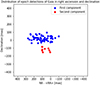 |
Fig. A.5. Same as in Fig. A.1, but for Gaia DR3 object 502675674 epoch positions. |
| In the text | |
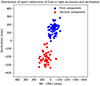 |
Fig. A.6. Same as in Fig. A.1, but for Gaia DR3 object 481987315 epoch positions. |
| In the text | |
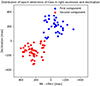 |
Fig. A.7. Same as in Fig. A.1, but for Gaia DR3 object 451971551 epoch positions. |
| In the text | |
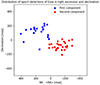 |
Fig. A.8. Same as in Fig. A.1, but for Gaia DR3 object 666080784 epoch positions. |
| In the text | |
|
Fig. B.1. Gaia epochs (in red) of the DR3 object 413107379 associated with the corresponding PanSTARRS1 image. The left panel shows the surrounding of the source and the unique point in the Gaia catalog. The right panel is the zoom into the galaxy, showing the two spots of the epoch positions. The maximum separation between two points inside the same component is 50 mas. |
| In the text | |
|
Fig. B.2. Gaia epochs (in red) of the DR3 object 709923047 associated with the corresponding PanSTARRS1 image. The left panel shows the surrounding of the source and the unique point in the Gaia catalog. The right panel is the zoom into the galaxy, showing the two spots of the epoch positions. The maximum separation between two points inside the same component is 50 mas. |
| In the text | |
|
Fig. B.3. Gaia epochs (in red) of the DR3 object 185414449 associated with the corresponding PanSTARRS1 image. The left panel shows the surrounding of the source and the unique point in the Gaia catalog. The right panel is the zoom into the galaxy, showing the two spots of the epoch positions. The maximum separation between two points inside the same component is 50 mas. |
| In the text | |
|
Fig. B.4. Gaia epochs (in red) of the DR3 object 372100463 associated with the corresponding PanSTARRS1 image. The left panel shows the surrounding of the source and the unique point in the Gaia catalog. The right panel is the zoom into the galaxy, showing the two spots of the epoch positions. The maximum separation between two points inside the same component is 40 mas. |
| In the text | |
|
Fig. B.5. Gaia epochs (in red) of the DR3 object 502675674 associated with the corresponding 2MASS image. The left panel shows the surrounding of the source and the unique point in the Gaia catalog. The right panel is the zoom into the galaxy, showing the two spots of the epoch positions. The maximum separation between two points inside the same component is 40 mas. |
| In the text | |
|
Fig. B.6. Gaia epochs (in red) of the DR3 object 481987315 associated with the corresponding PanSTARRS1 image. The left panel shows the surrounding of the source and the unique point in the Gaia catalog. The right panel is the zoom into the galaxy, showing the two spots of the epoch positions. The maximum separation between two points inside the same component is 30 mas. |
| In the text | |
|
Fig. B.7. Gaia epochs (in red) of the DR3 object 451971551 associated with the corresponding PanSTARRS1 image. The left panel shows the surrounding of the source and the unique point in the Gaia catalog. The right panel is the zoom into the galaxy, showing the two spots of the epoch positions. The maximum separation between two points inside the same component is 30 mas. |
| In the text | |
|
Fig. B.8. Gaia epochs (in red) of the DR3 object 666080784 associated with the corresponding 2MASS image. The left panel shows the surrounding of the source and the unique point in the Gaia catalog. The right panel is the zoom into the galaxy, showing the two spots of the epoch positions. The maximum separation between two points inside the same component is 30 mas. |
| In the text | |
Current usage metrics show cumulative count of Article Views (full-text article views including HTML views, PDF and ePub downloads, according to the available data) and Abstracts Views on Vision4Press platform.
Data correspond to usage on the plateform after 2015. The current usage metrics is available 48-96 hours after online publication and is updated daily on week days.
Initial download of the metrics may take a while.