Fig. 3
Download original image
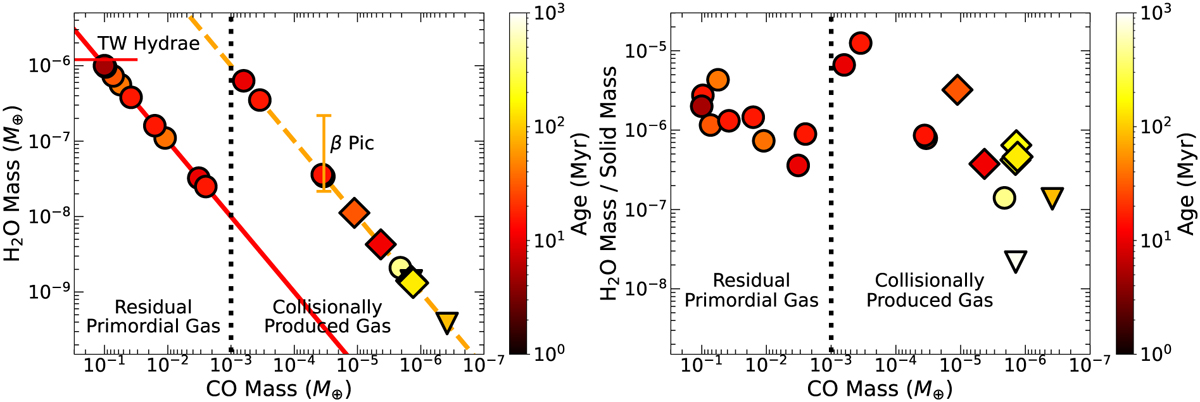
Predicted water vapor mass and its mass ratio relative to the solid mass as a function of CO mass in the left and right panels, respectively. All the symbols are defined in Fig. 2. As an example, the H2O-to-CO conversion factor is switched from Eq. (12) for Hypothesis 1 to Eq. (14) for Hypothesis 2 at the transition CO mass of 10–3; for clear comparison, these conversion factors are shown by the solid red and the dashed orange lines for Hypotheses 1 and 2, respectively (left panel). Such switching results in a clear jump in the H2O mass and its mass ratio. In the left panel, tentative constraints derived from previous observations are also plotted; the water vapor mass estimated for the protoplanetary disk around TW Hydrae is denoted by the horizontal, solid red line segment, while that for the debris disk around β Pic is represented by the error bar. The non-monotonic distributions in the water vapor mass and its mass ratio relative to the solid mass enable better determination of the origin of gas in debris disks.
Current usage metrics show cumulative count of Article Views (full-text article views including HTML views, PDF and ePub downloads, according to the available data) and Abstracts Views on Vision4Press platform.
Data correspond to usage on the plateform after 2015. The current usage metrics is available 48-96 hours after online publication and is updated daily on week days.
Initial download of the metrics may take a while.