Fig. 2
Download original image
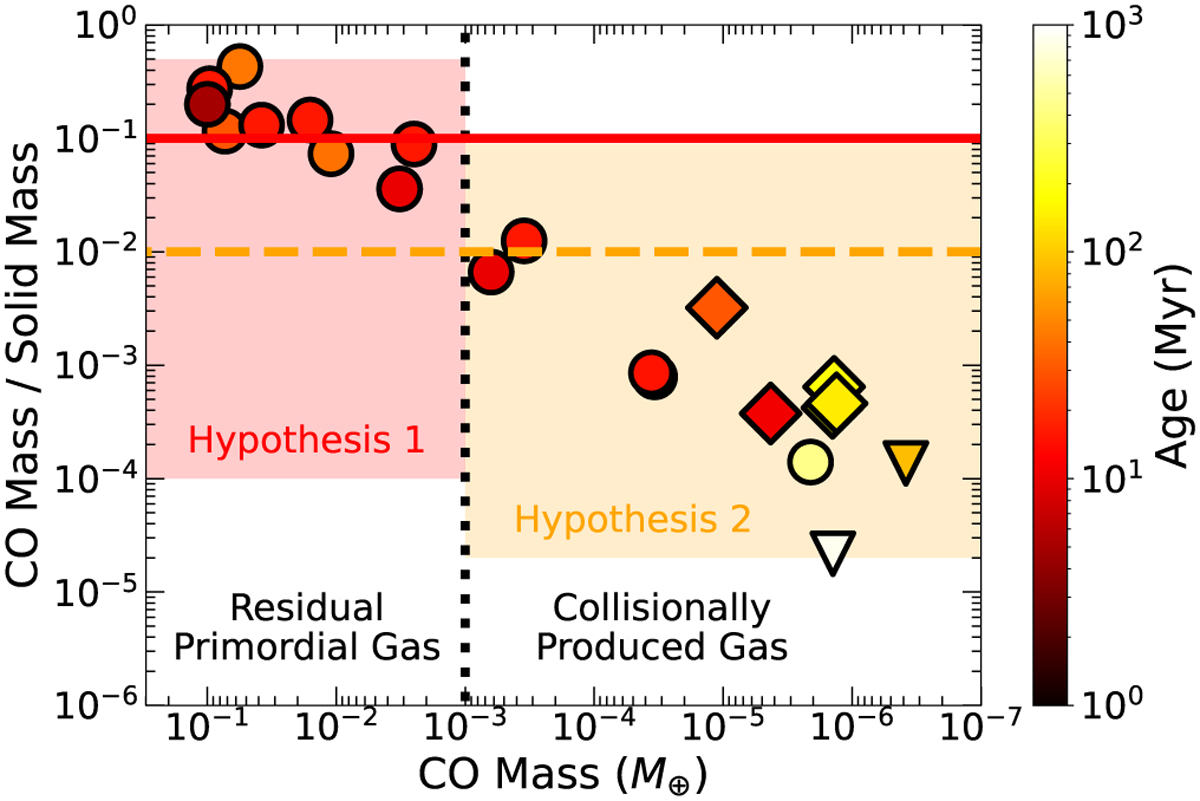
Mass ratio of CO gas to solids as a function of CO gas mass. The theoretical estimates derived from the order-of-magnitude analysis are denoted by the solid red, dashed orange, and dotted black lines, respectively (see Eqs. (5), (9), and (1)). For comparison, the observed data are included (Moór et al. 2017, 2019; Di Folco et al. 2020; Rebollido et al. 2022); the circles represent targets that exhibit detections of both CO gas and dust, the triangles are for targets with dust-only detections (i.e., the upper limit for CO gas mass), and the diamonds are for targets with upper limits for both CO gas and dust. The color of each data point corresponds to the age of the target, as shown in the color bar on the right. Different disk parameters lead to different values of the CO-tosolid mass ratio (Table 1). The shaded red and orange regions represent possible ranges corresponding to Hypotheses 1 and 2, respectively. It is clear that the CO-to-solid mass ratio is not a reliable probe for tightly constraining the origin of the observed gas.
Current usage metrics show cumulative count of Article Views (full-text article views including HTML views, PDF and ePub downloads, according to the available data) and Abstracts Views on Vision4Press platform.
Data correspond to usage on the plateform after 2015. The current usage metrics is available 48-96 hours after online publication and is updated daily on week days.
Initial download of the metrics may take a while.