Fig. C.1.
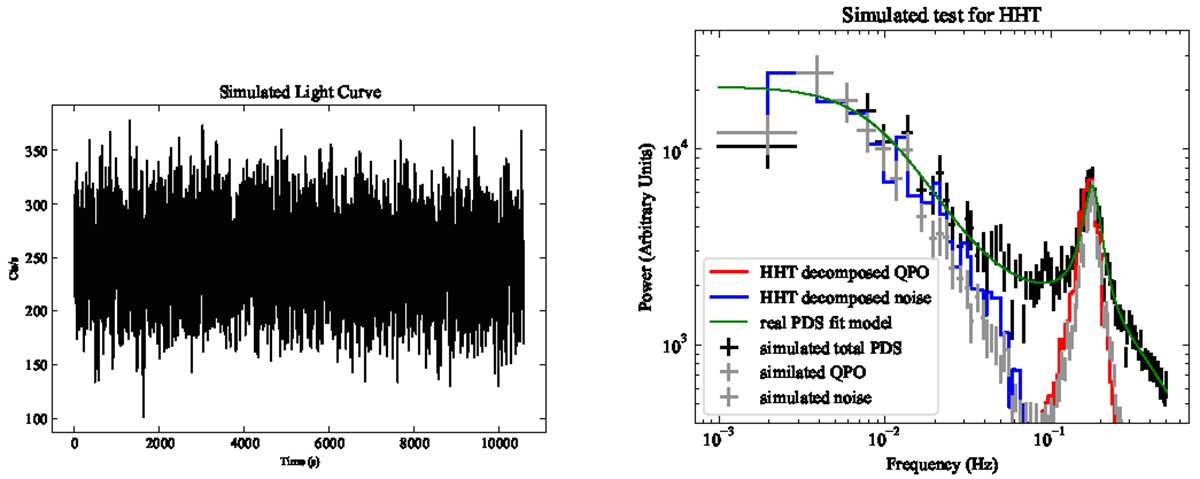
Download original image
Simulated light curve and power density spectrum (PDS) analysis. Left panel: Simulated light curve with two broadband noise components at different break frequencies and one QPO signal at ∼0.18 Hz. Right panel: PDS of the simulated light curve (black points) and the fitting model of the real PDS (green line). The gray lines represent the simulated low-frequency noise and QPO components in the PDS. The blue and red lines represent the VMD components of noise and the QPO signal in the PDS.
Current usage metrics show cumulative count of Article Views (full-text article views including HTML views, PDF and ePub downloads, according to the available data) and Abstracts Views on Vision4Press platform.
Data correspond to usage on the plateform after 2015. The current usage metrics is available 48-96 hours after online publication and is updated daily on week days.
Initial download of the metrics may take a while.