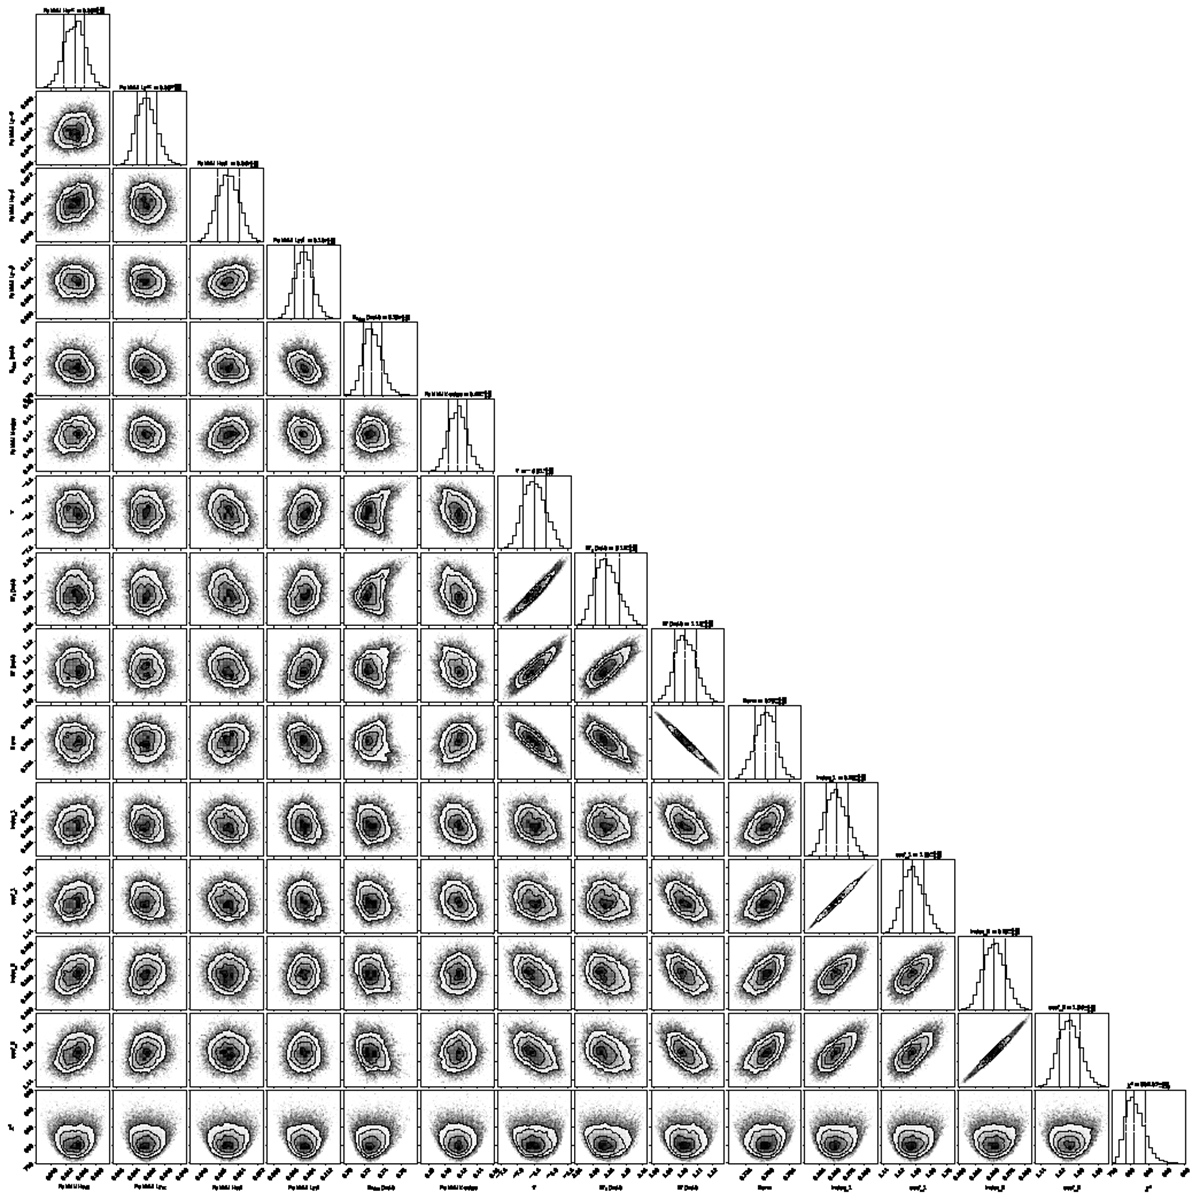
Fig. A.1.
Download original image
Distribution of the parameters from the 100,000 chain of MCMC results of the spectral fittings on the QPO phase 0.5-0.6 (for visualization purposes). The multi-parameter correlations indicate that only the continuum parameters, kTe and τ from the thcomp, and kT and Norm from the comptt components exhibit strong correlations. In contrast, the strength of the absorption lines and edge show no significant correlation with other parameters.
Current usage metrics show cumulative count of Article Views (full-text article views including HTML views, PDF and ePub downloads, according to the available data) and Abstracts Views on Vision4Press platform.
Data correspond to usage on the plateform after 2015. The current usage metrics is available 48-96 hours after online publication and is updated daily on week days.
Initial download of the metrics may take a while.