Open Access
Fig. 4.
Download original image
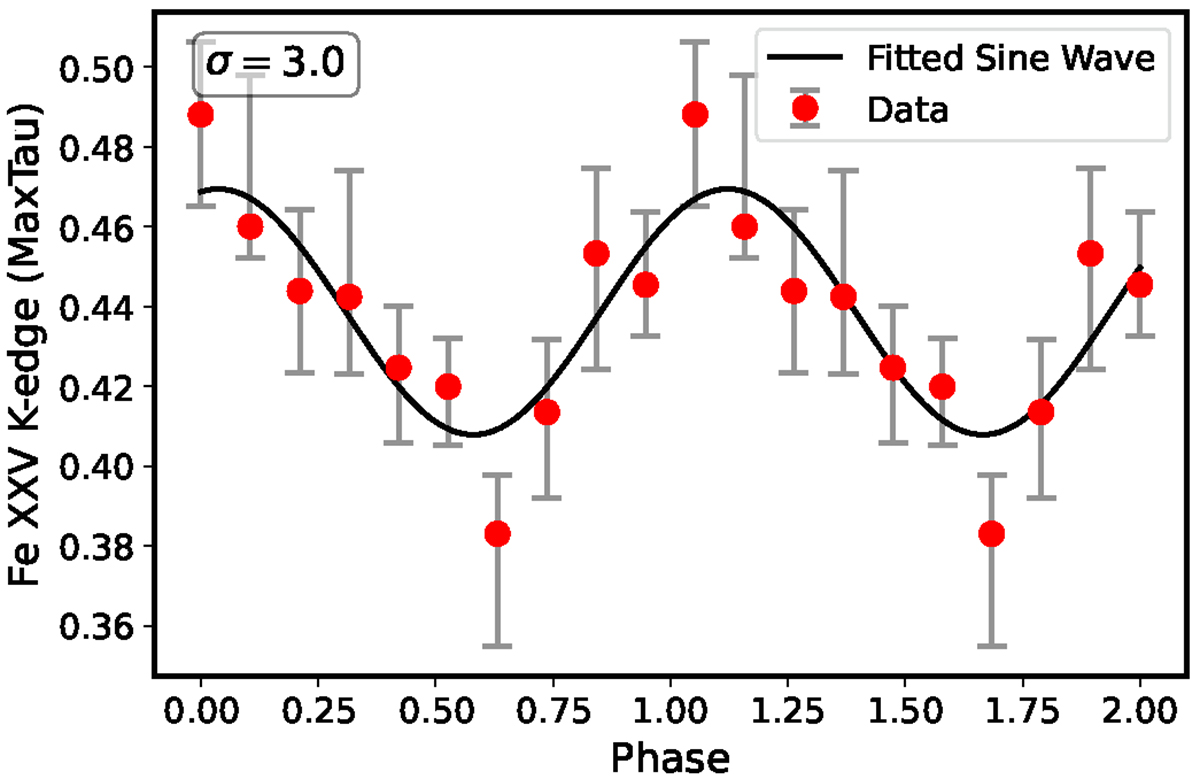
Confidence level of the variation between the absorption depth (MaxTau) of Fe XXV K-edge and the QPO phase (3σ). The black line represents the fitted sine wave based on the simulation results, and the red points indicate the actual observational data, complete with error bars.
Current usage metrics show cumulative count of Article Views (full-text article views including HTML views, PDF and ePub downloads, according to the available data) and Abstracts Views on Vision4Press platform.
Data correspond to usage on the plateform after 2015. The current usage metrics is available 48-96 hours after online publication and is updated daily on week days.
Initial download of the metrics may take a while.