Fig. 3.
Download original image
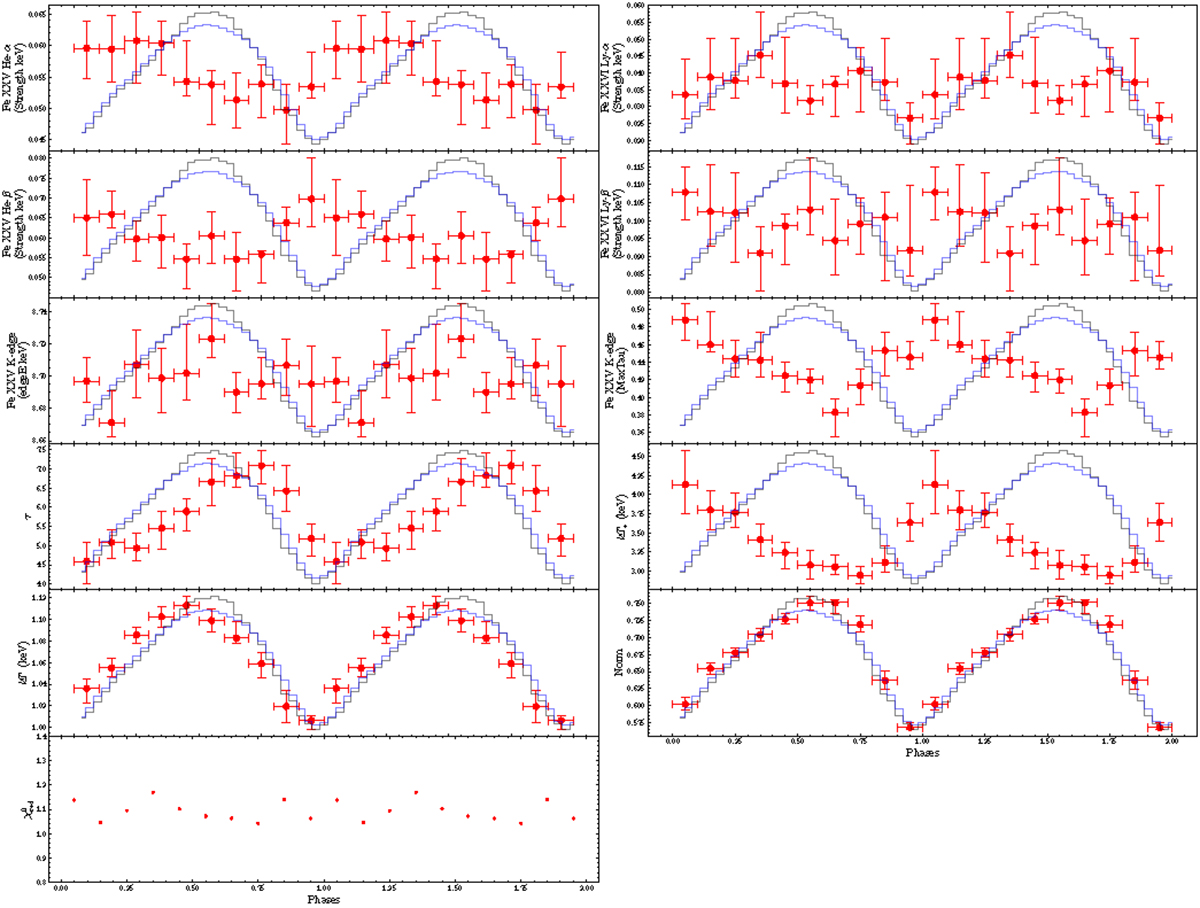
QPO phase derived from combined NICER data (blue line) and a single NuSTAR observation (black line). The first four panels illustrate the strength of the iron absorption lines: Fe XXV He-α at ≃6.7 keV, Fe XXVI Ly-α at ≃6.97 keV, Fe XXV He-β at ≃7.8 keV, and Fe XXVI Ly-β at ≃8.27 keV, each shown with respect to the QPO phase. The fifth and sixth panels in the third row depict the edge threshold energy (edgeE) and absorption depth (MaxTau) of the Fe XXV K-edge. The fourth and fifth rows show the change in the continuum parameters with QPO phase. Finally, the last panel displays the spectral fitting residuals.
Current usage metrics show cumulative count of Article Views (full-text article views including HTML views, PDF and ePub downloads, according to the available data) and Abstracts Views on Vision4Press platform.
Data correspond to usage on the plateform after 2015. The current usage metrics is available 48-96 hours after online publication and is updated daily on week days.
Initial download of the metrics may take a while.