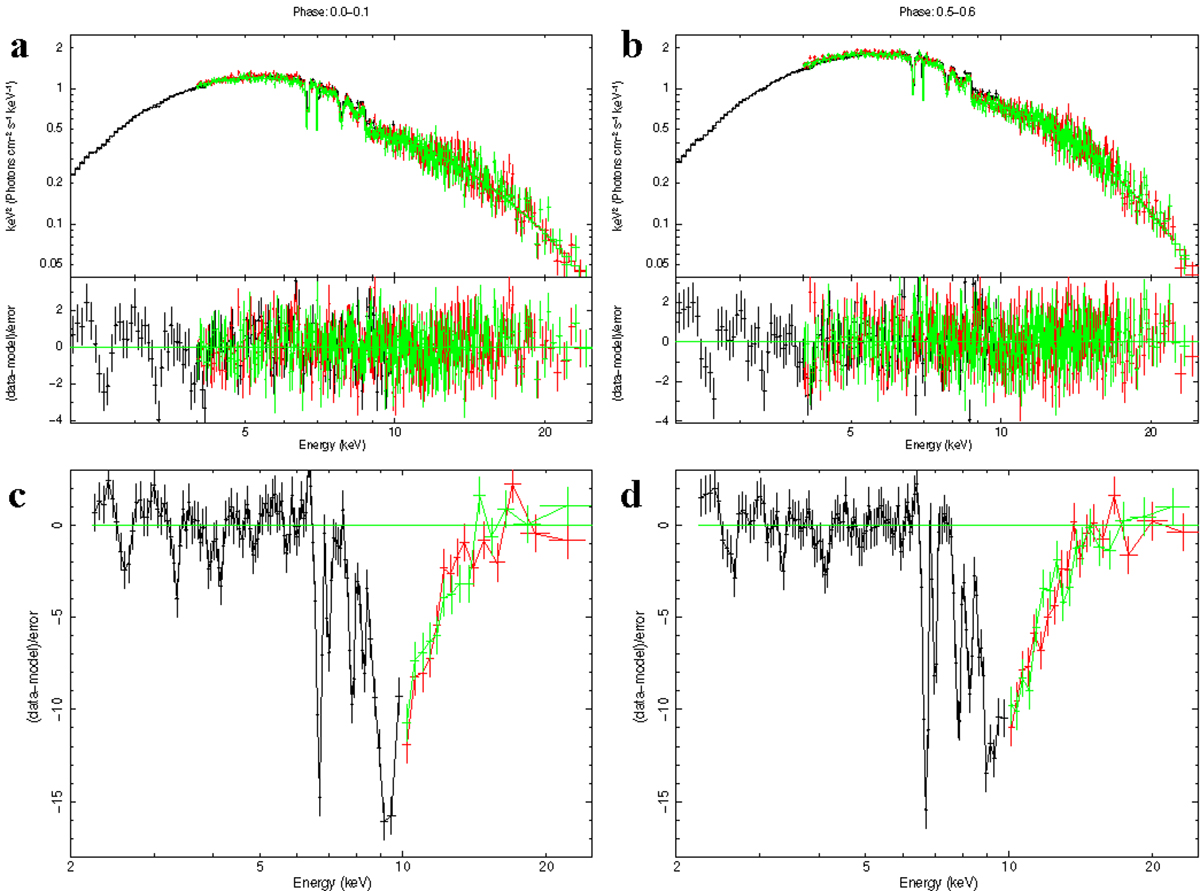
Fig. 2.
Download original image
Spectral fitting and residual analysis for NICER and NuSTAR observations. Panels a and b: Spectral fit using the model TBabs × (4 × gabs)×edge × thcomp × comptt. The black lines represent the NICER data in the energy range of 1−10 keV. The red and green lines correspond to the NuSTAR data from the FPMA and FPMB mirrors, respectively, covering the energy range of 4−25 keV. Panels c and d: Residuals of the spectral fit without the gabs and edge components. The black lines indicate the NICER data, and the red and green lines represent the FPMA and FPMB data from NuSTAR. The depicted energy ranges are 2−10 keV for NICER and 10−25 keV for NuSTAR.
Current usage metrics show cumulative count of Article Views (full-text article views including HTML views, PDF and ePub downloads, according to the available data) and Abstracts Views on Vision4Press platform.
Data correspond to usage on the plateform after 2015. The current usage metrics is available 48-96 hours after online publication and is updated daily on week days.
Initial download of the metrics may take a while.