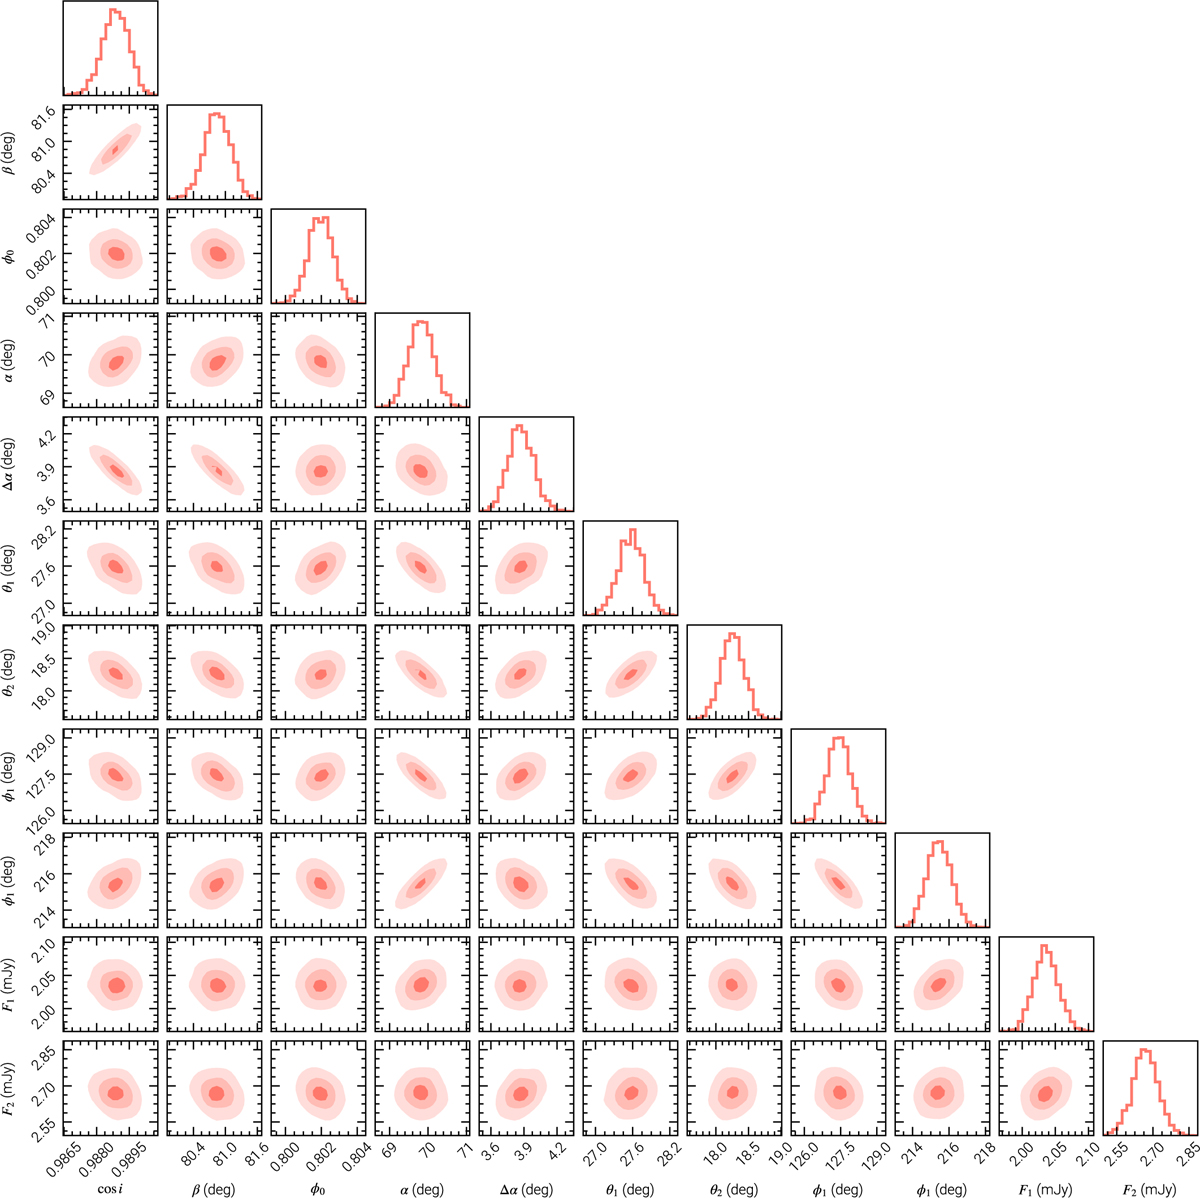
Fig. C.2
Download original image
Posterior distributions of the best-fitting model parameters listed in Table 1 plotted using corner (Foreman-Mackey 2016). The shaded regions in each panel bar the diagonal ones show the 16th, 50th, and 84th percentiles going from darkest to lightest in colour. We have smoothed the contours by setting the smooth parameter to 1 in the corner function to better-highlight the 16th percentile region. The diagonal panels show the flattened histogram for each parameter (unsmoothed).
Current usage metrics show cumulative count of Article Views (full-text article views including HTML views, PDF and ePub downloads, according to the available data) and Abstracts Views on Vision4Press platform.
Data correspond to usage on the plateform after 2015. The current usage metrics is available 48-96 hours after online publication and is updated daily on week days.
Initial download of the metrics may take a while.