Fig. 4
Download original image
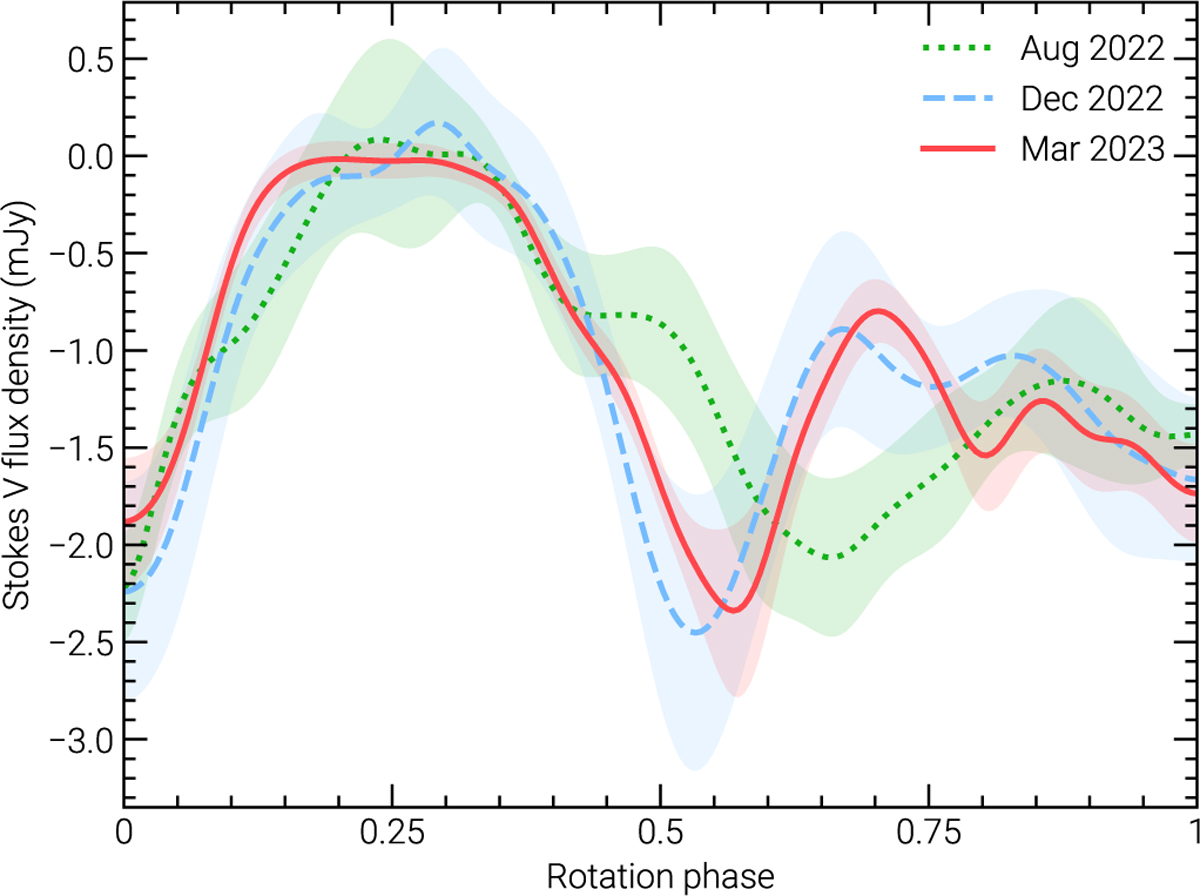
Comparison of the Stokes V lightcurves of J0623 on obtained with ATCA on 14 Aug. 2022 (1.3 – 1.77 GHz) and 16 Dec. 2022 (1.3 – 1.6 GHz), and with MeerKAT on 27 Mar. 2023 (1.3 – 1.5 GHz). For clarity, we linearly resampled the data using 500 uniformly-spaced points in rotation phase, and smoothed the result with a Gaussian with a width of 5σ using SciPy’s gaussian_filterld function. The shaded regions show the 1σ variance in the Stokes V flux density. The structure appears to change over a timescale of around 6 months, which we speculate could be due to a magnetic cycle (see Section 4).
Current usage metrics show cumulative count of Article Views (full-text article views including HTML views, PDF and ePub downloads, according to the available data) and Abstracts Views on Vision4Press platform.
Data correspond to usage on the plateform after 2015. The current usage metrics is available 48-96 hours after online publication and is updated daily on week days.
Initial download of the metrics may take a while.