Fig. 7
Download original image
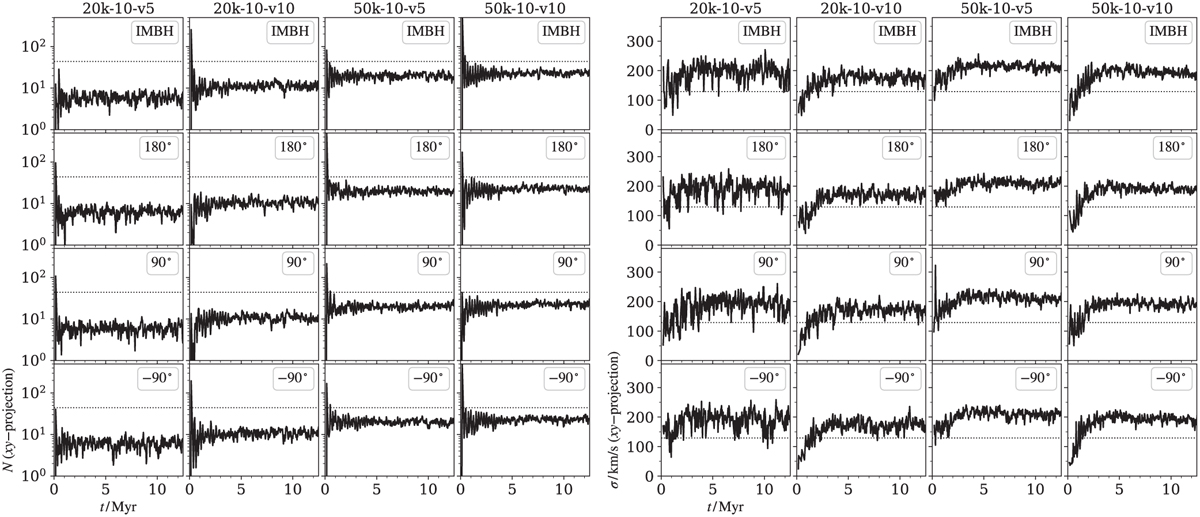
Time evolution of the number of stars in a specified region (left-hand plots) and their velocity dispersion (right-hand plots), as seen in xy projection. For each model (columns), the values in four regions are shown: around the IMBH (top row), on the opposite side of the SMBH from the IMBH (labelled 180°), and in two regions perpendicular to the SMBH–IMBH vector (labelled ±90°). The dashed lines show the known population and velocity dispersion of IRS13, respectively.
Current usage metrics show cumulative count of Article Views (full-text article views including HTML views, PDF and ePub downloads, according to the available data) and Abstracts Views on Vision4Press platform.
Data correspond to usage on the plateform after 2015. The current usage metrics is available 48-96 hours after online publication and is updated daily on week days.
Initial download of the metrics may take a while.