Fig. 8.
Download original image
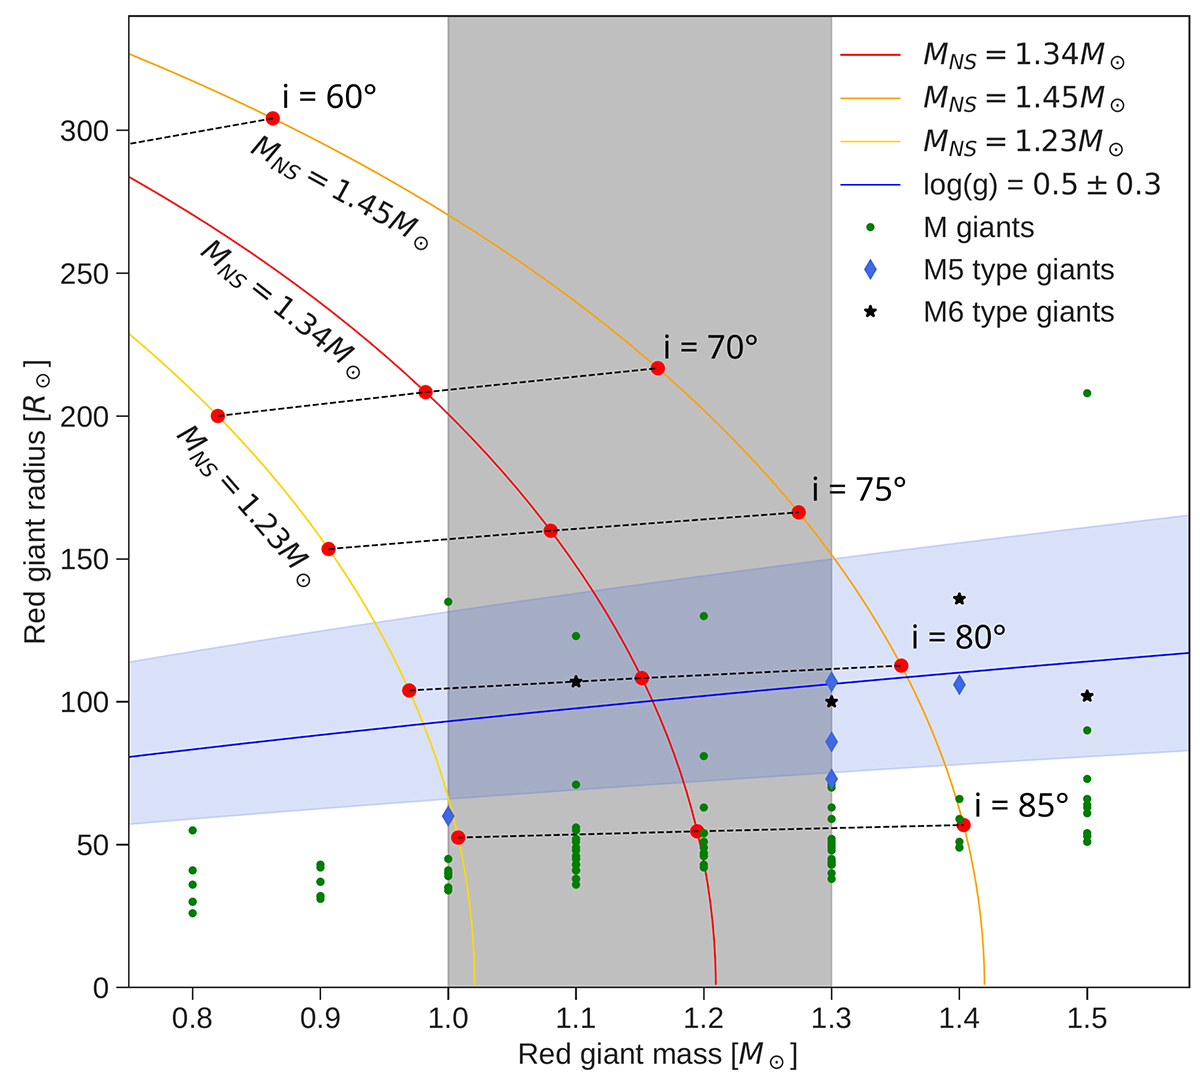
Companion radius as function of mass. The solid lines indicate the limits placed on the radius of the companion at different inclinations for a given neutron star mass. The mass-radius relation of M giants from the results by Dumm & Schild (1998) is indicated by the green dots. M5- and M6-type giants from this sample are represented by blue diamonds and black stars, respectively. The solid blue line represents the radius calculated from the gravitational acceleration log(g) as determined by Hinkle et al. (2006) for a given red giant mass, and the area shaded in light blue indicates the corresponding uncertainty. The area shaded in grey indicates the mass limits of the red giant as determined by Hinkle et al. (2006) through a spectroscopic analysis of the oxygen isotopic abundances of 17O and 16O.
Current usage metrics show cumulative count of Article Views (full-text article views including HTML views, PDF and ePub downloads, according to the available data) and Abstracts Views on Vision4Press platform.
Data correspond to usage on the plateform after 2015. The current usage metrics is available 48-96 hours after online publication and is updated daily on week days.
Initial download of the metrics may take a while.