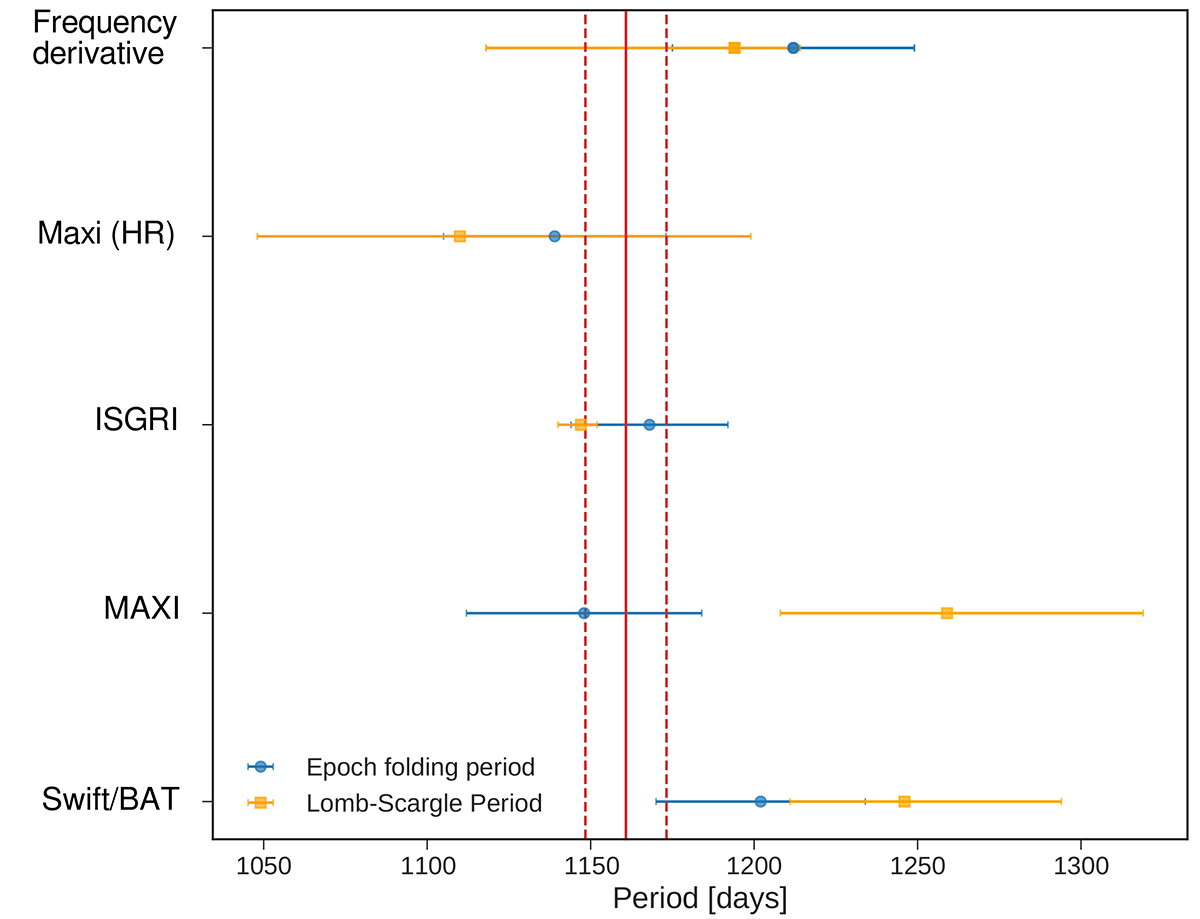
Fig. 7.
Download original image
Visual summary of the analysis results. The blue circles represent the results obtained with the epoch-folding approach, and the results obtained with the Lomb-Scargle technique are shown as orange squares. The data sets are Swift, MAXI, ISGRI, MAXI hardness ratio, and spin-frequency derivative evolution, as indicated by the labels in the figure. The solid red line indicates the 1160.8 d radial velocity period obtained by Hinkle et al. (2006), and the dashed lines mark the corresponding 12.4 d uncertainty on this value.
Current usage metrics show cumulative count of Article Views (full-text article views including HTML views, PDF and ePub downloads, according to the available data) and Abstracts Views on Vision4Press platform.
Data correspond to usage on the plateform after 2015. The current usage metrics is available 48-96 hours after online publication and is updated daily on week days.
Initial download of the metrics may take a while.