Fig. 12
Download original image
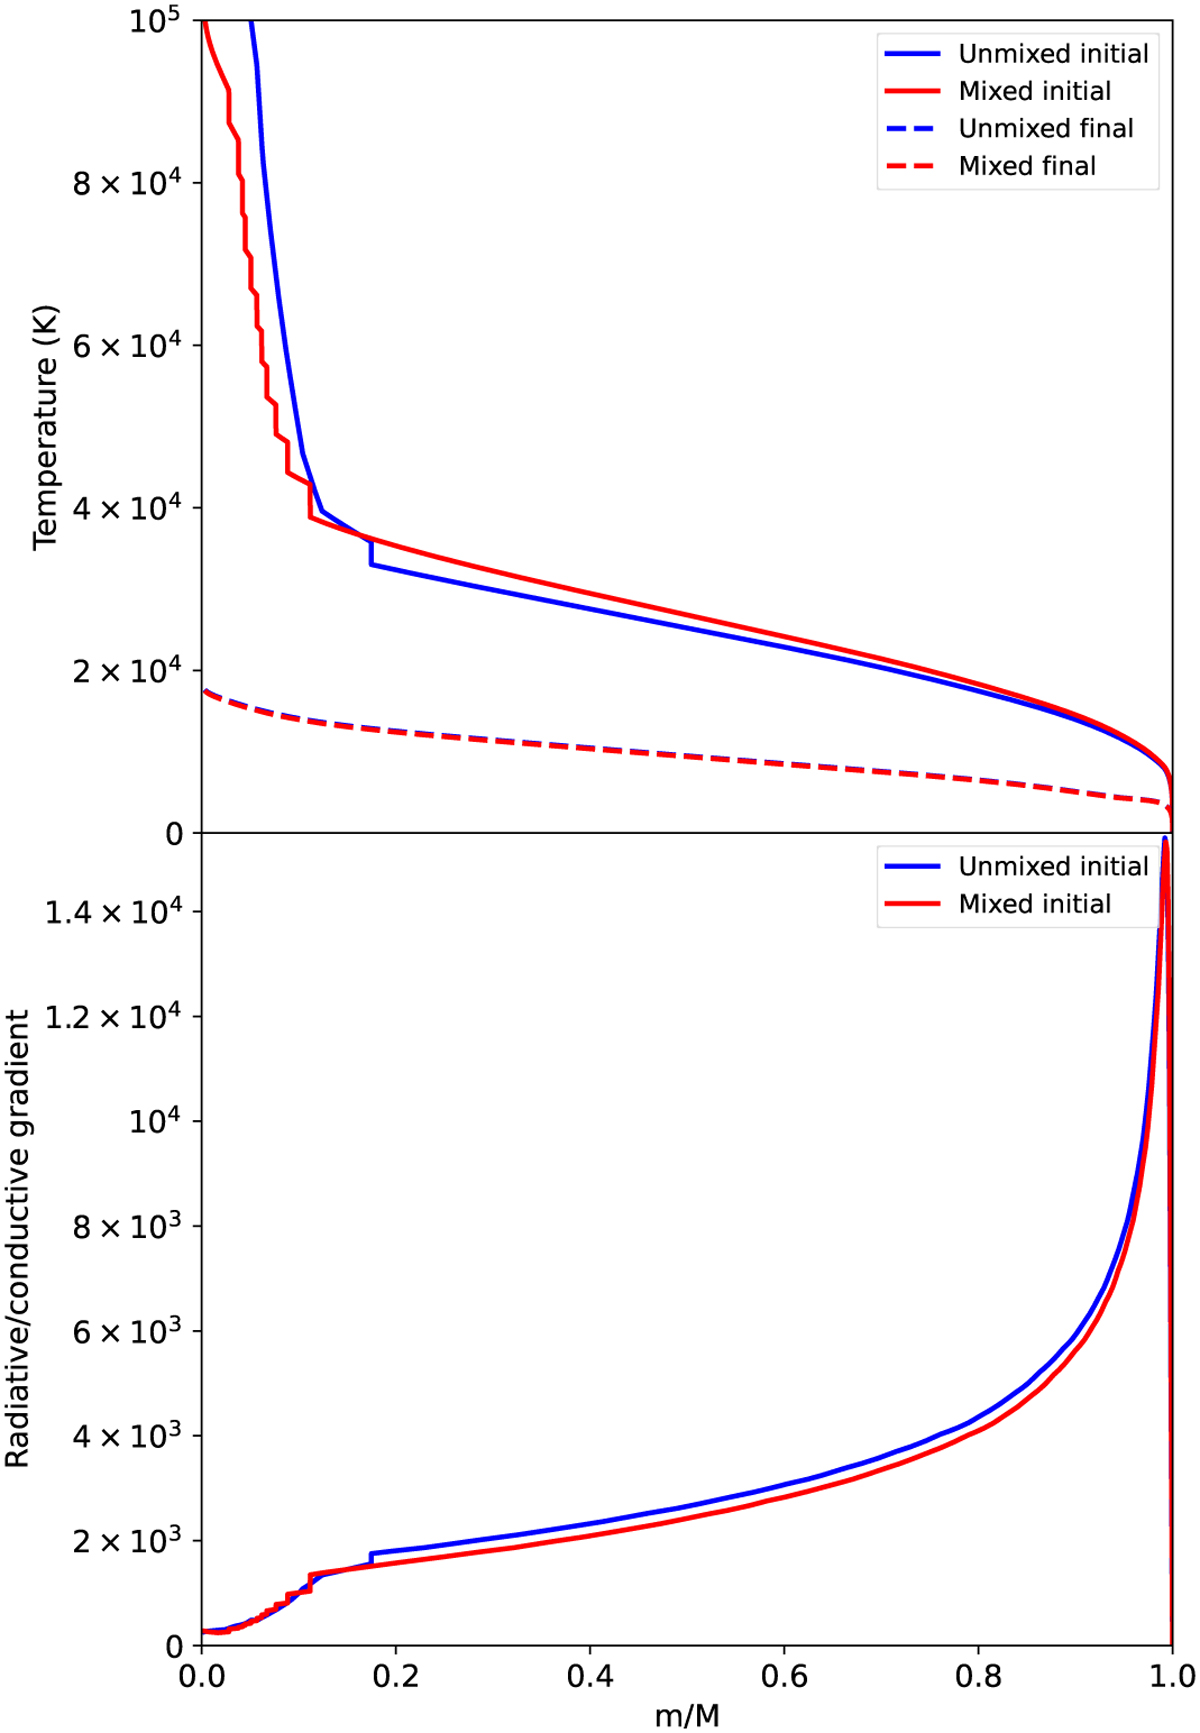
Temperature (top) and radiative-conductive gradient (bottom) for the compact compositional structure in its original state (unmixed) or starting with its final compositional structure (mixed). The temperature is shown at both the start of the simulation and after 4.5 Gyr, while the radiative-conductive gradient is only shown at the start. The final temperature structures are very similar, making it hard to distinguish between them.
Current usage metrics show cumulative count of Article Views (full-text article views including HTML views, PDF and ePub downloads, according to the available data) and Abstracts Views on Vision4Press platform.
Data correspond to usage on the plateform after 2015. The current usage metrics is available 48-96 hours after online publication and is updated daily on week days.
Initial download of the metrics may take a while.