Fig. 6
Download original image
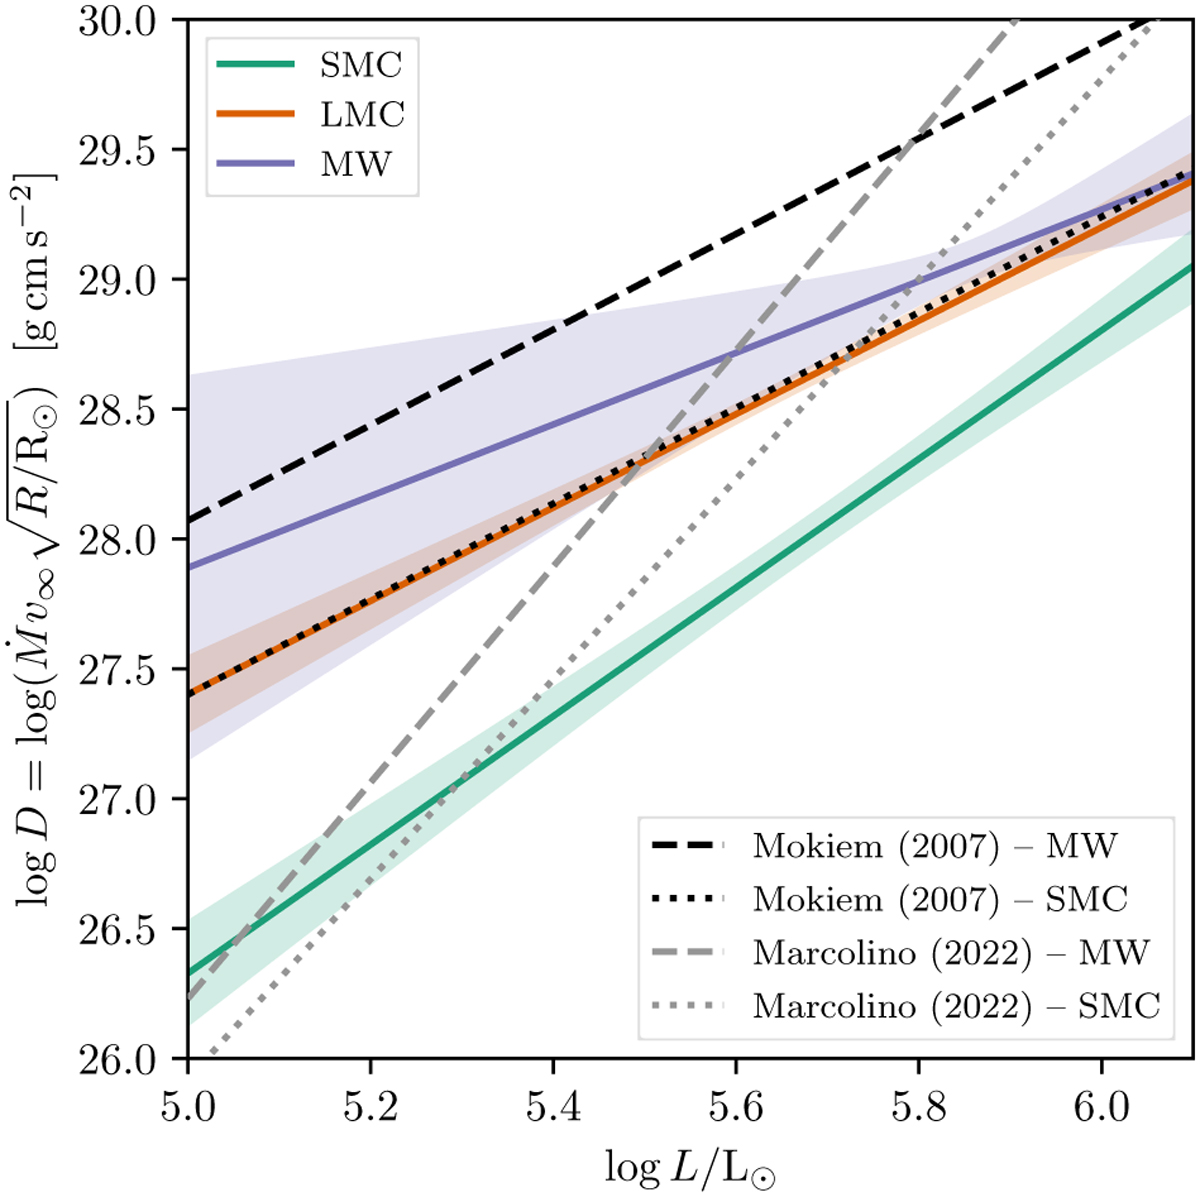
Fits to the empirically determined modified wind momentum as a function of luminosity. The solid colored lines show the fits to the MW, LMC, and SMC samples presented here. The dashed and dash-dotted black and gray lines indicate the modified wind momentum relations from Mokiem et al. (2007) and Marcolino et al. (2022), respectively. The values representing the fits are listed in Table 7.
Current usage metrics show cumulative count of Article Views (full-text article views including HTML views, PDF and ePub downloads, according to the available data) and Abstracts Views on Vision4Press platform.
Data correspond to usage on the plateform after 2015. The current usage metrics is available 48-96 hours after online publication and is updated daily on week days.
Initial download of the metrics may take a while.