Fig. 5
Download original image
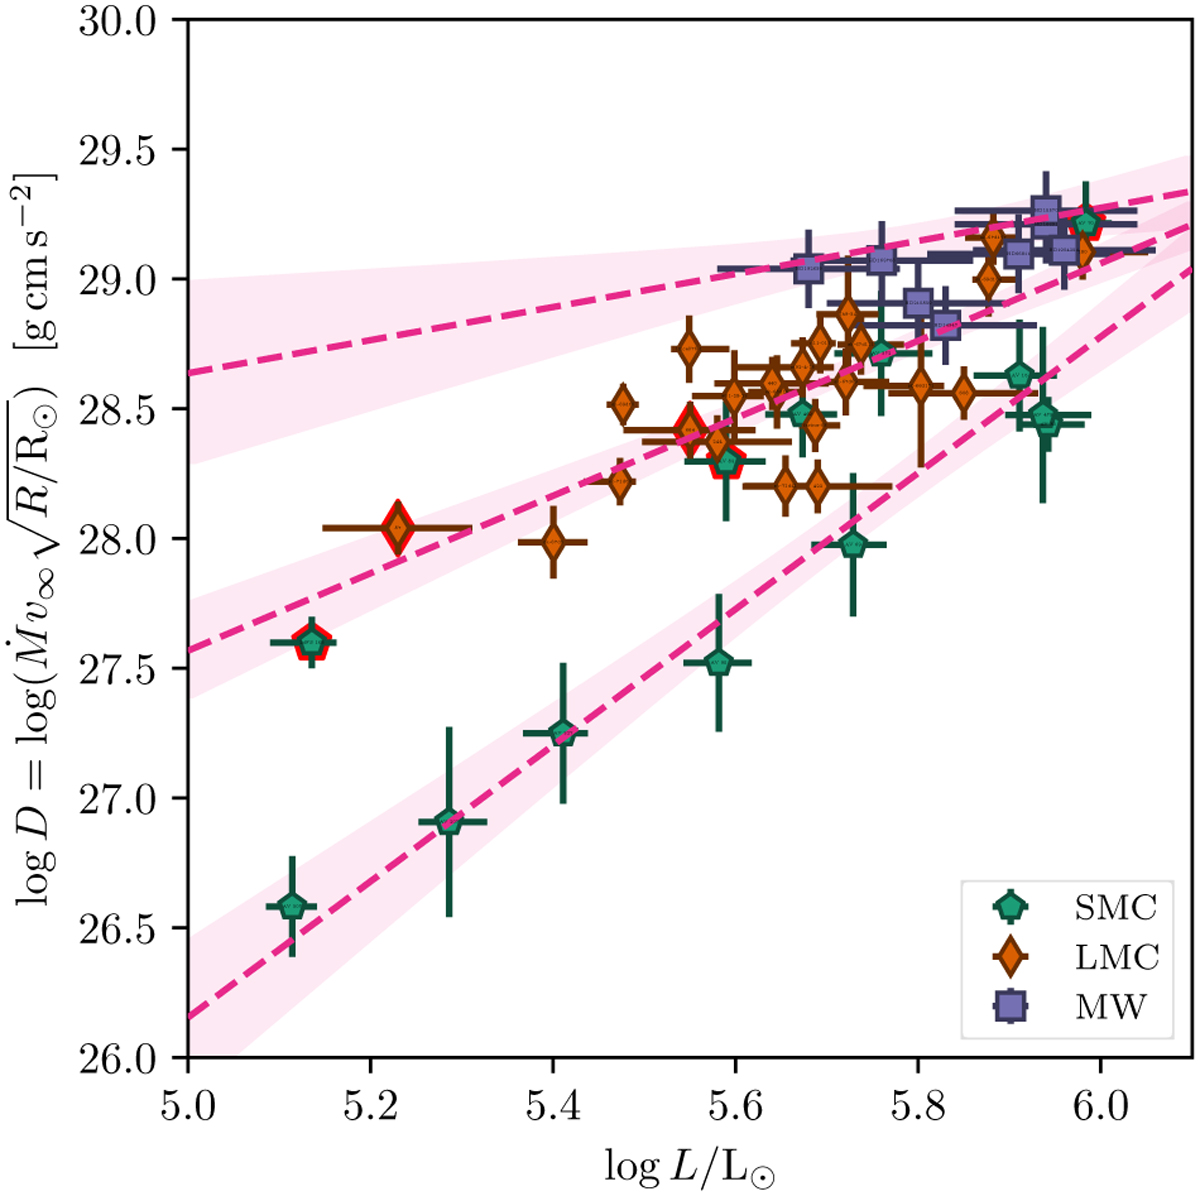
Modified wind momentum as function of luminosity and metallicity, as in Figure 4, but now fit with Equation (9) to the three samples, instead of separate linear fits for each sample. The dashed magenta lines and pink shaded regions indicate the best fit and the 1σ confidence interval, respectively. Equation (9) has been evaluated at Z = 1.0, 0.5, and 0.2 Z⊙. The points with a red border are unreliable fits that are likely not representative of their physical properties; these are not included in the fit.
Current usage metrics show cumulative count of Article Views (full-text article views including HTML views, PDF and ePub downloads, according to the available data) and Abstracts Views on Vision4Press platform.
Data correspond to usage on the plateform after 2015. The current usage metrics is available 48-96 hours after online publication and is updated daily on week days.
Initial download of the metrics may take a while.