Fig. 3
Download original image
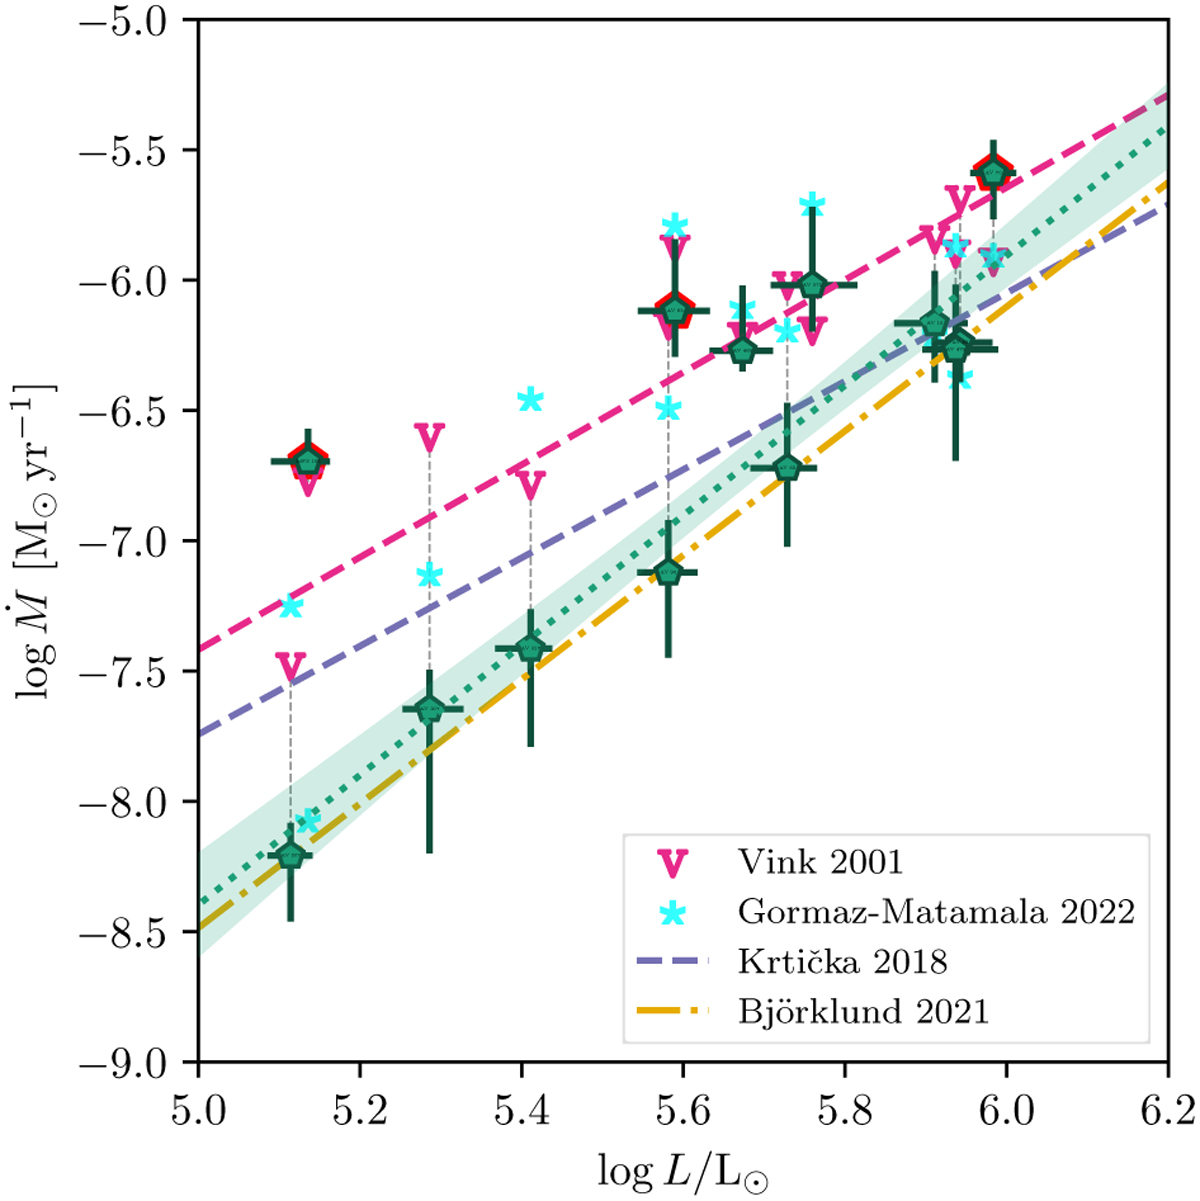
Mass-loss rate as a function of luminosity. The fit to the empirical mass-loss rates and its 1σ uncertainty are indicated with the dotted green line and the shaded region, respectively. The mass-loss rate – luminosity relations of Krtička & Kubát (2018) and Björklund et al. (2021) are shown with the dashed blue and yellow lines, respectively. For the mass-loss predictions of Vink et al. (2001), we used their equation (24) to obtain the predicted rates for each star based on their properties. The magenta V indicate these rates, and the dashed magenta line corresponds to the fit to these points. The light blue stars indicate the mass-loss rates of equation 7 from Gormaz-Matamala et al. (2022b). Points with a red border are unreliable fits that are likely not representative of their physical properties; these are not included in the fit.
Current usage metrics show cumulative count of Article Views (full-text article views including HTML views, PDF and ePub downloads, according to the available data) and Abstracts Views on Vision4Press platform.
Data correspond to usage on the plateform after 2015. The current usage metrics is available 48-96 hours after online publication and is updated daily on week days.
Initial download of the metrics may take a while.