Fig. 2
Download original image
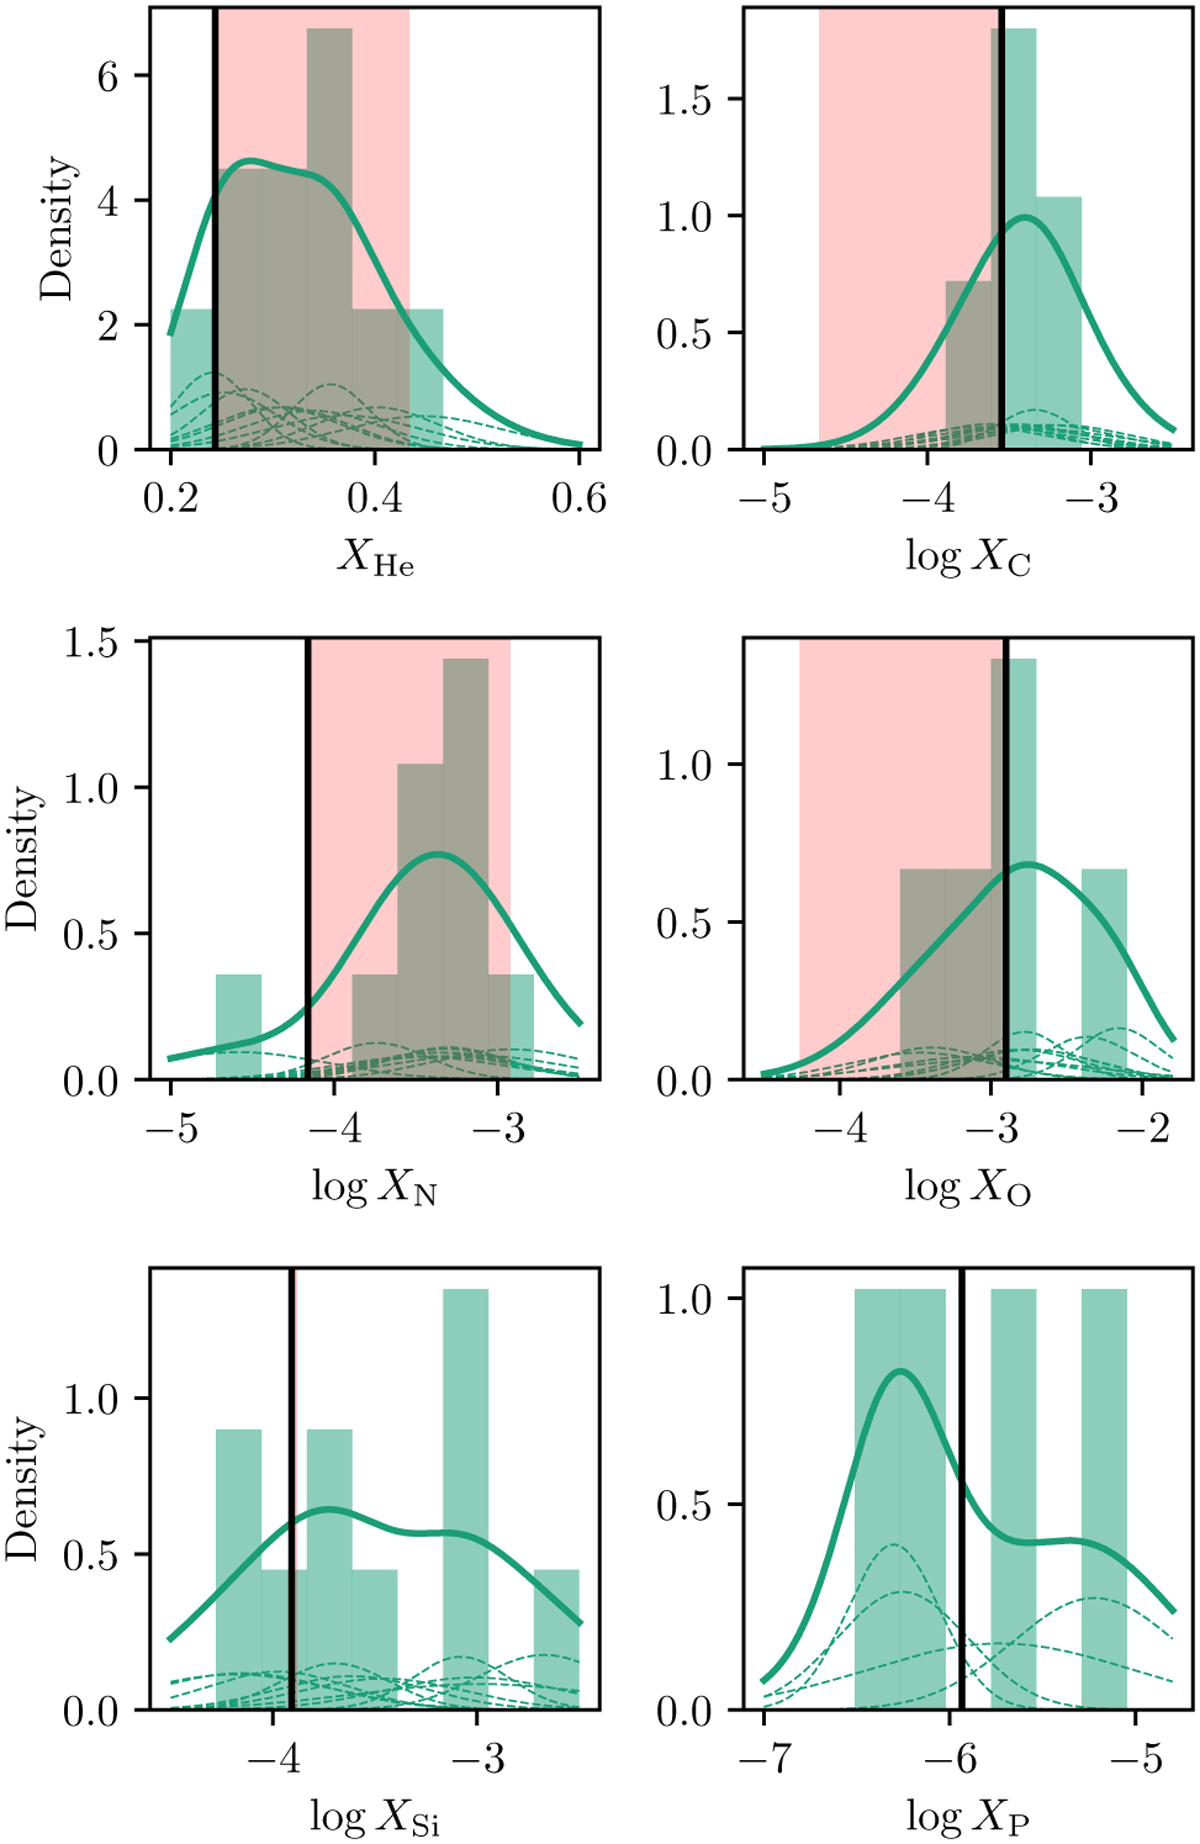
Distribution of the surface mass fractions of He, C, N, O, Si, and P from the FASTWIND/GA fitting of SMC stars. The solid green line indicates an approximate kernel density estimate of the distribution taking the uncertainties on the best-fit values into account. The thin dashed lines show the contribution of the individual sources. The vertical black line shows the baseline mass fraction from Dopita et al. (2019) for all elements except phosphorus, for which we show the scaled (by 0.2) solar abundance from Asplund et al. (2009). The area marked in red shows the surface depletion or enrichment that can be expected due to mixing based on the evolution of a 40 M⊙ star with an initial rotation of 389 km s−1 (Brott et al. 2011). For phosphorus, only stars with a reasonable fit are included. The helium mass fractions are taken from the optical-only fit. All other fractions are from the optical and UV fit.
Current usage metrics show cumulative count of Article Views (full-text article views including HTML views, PDF and ePub downloads, according to the available data) and Abstracts Views on Vision4Press platform.
Data correspond to usage on the plateform after 2015. The current usage metrics is available 48-96 hours after online publication and is updated daily on week days.
Initial download of the metrics may take a while.