Fig. F.1
Download original image
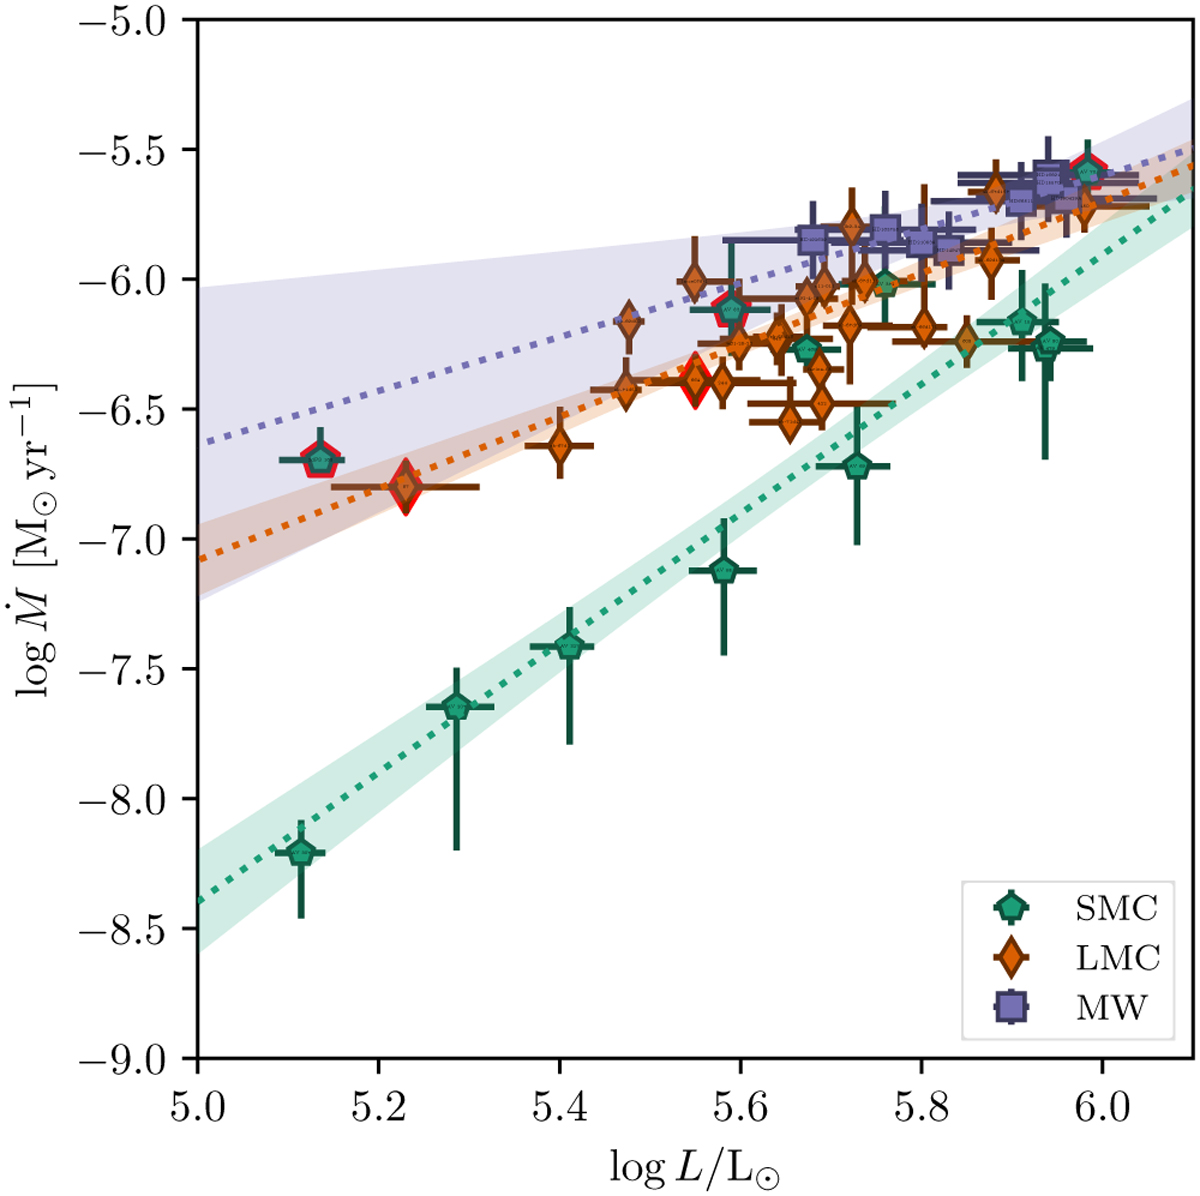
Mass-loss rates as function of luminosity for samples of SMC (this work), LMC (Hawcroft et al. 2024a, Brands et al. in prep.), and MW stars (Hawcroft et al. 2021). The dotted lines indicate the linear fits to the data for each of the metallicities, with the shaded region the 1 σ confidence interval on the fit. Stars with poor spectral fits, marked with a red border, are left out the linear fit here. The parameters of the fit are listed in Table F.1.
Current usage metrics show cumulative count of Article Views (full-text article views including HTML views, PDF and ePub downloads, according to the available data) and Abstracts Views on Vision4Press platform.
Data correspond to usage on the plateform after 2015. The current usage metrics is available 48-96 hours after online publication and is updated daily on week days.
Initial download of the metrics may take a while.